Court Transparency and Public Access
Analytics for Bench, Bar, and Public
A report by Joanna Ronchi, Analyst.
Audience Insights: Blandino and DeCastro
Joanna Ronchi, Data Scientist;
Sep 25, 2026, 10:00 PM
This report compares public viewing of ONJ’s Kim Blandino and Jose “Chille” DeCastro coverage to help sponsors assess the audience available through each matter. It considers the size of the video archive, current and historical viewing, individual videos, discovery sources, U.S. demographics, and viewing activity. DeCastro has more lifetime views, while Blandino has generated much more viewing in the most recent 12 complete months. Both matters reach a similar reported U.S. demographic audience. Nevada produces a strong concentration of views relative to its population. Key Results 604,081 Blandino views and 53,098 DeCastro views September 2025 through August 2026: Blandino generated about 11.4 times as many views. 1.54 million Blandino views and 1.86 million DeCastro views Lifetime totals for the selected video groups. DeCastro’s 2024 surge remains prominent in its cumulative total. 386,696 Blandino U.S. views and 28,434 DeCastro U.S. views September 2025 through August 2026. Among views with reported age data, at least 91% for each matter came from people age 45 or older. 20,709 identified Nevada views across both matters September 2025 through August 2026: 19,929 came from Blandino coverage and 780 from DeCastro coverage. 75.1% of DeCastro views came from its five leading videos The comparable figure for Blandino was 23.0%. DeCastro viewing was more concentrated in a few videos, while Blandino viewing was spread across more videos. Kim Blandino and Jose DeCastro Coverage Analytics 1. When did ONJ begin covering each matter, and how much coverage has it produced? This comparison timeline shows the span of dated uploads, the number of videos, and the lifetime hours viewers spent watching each selected group.
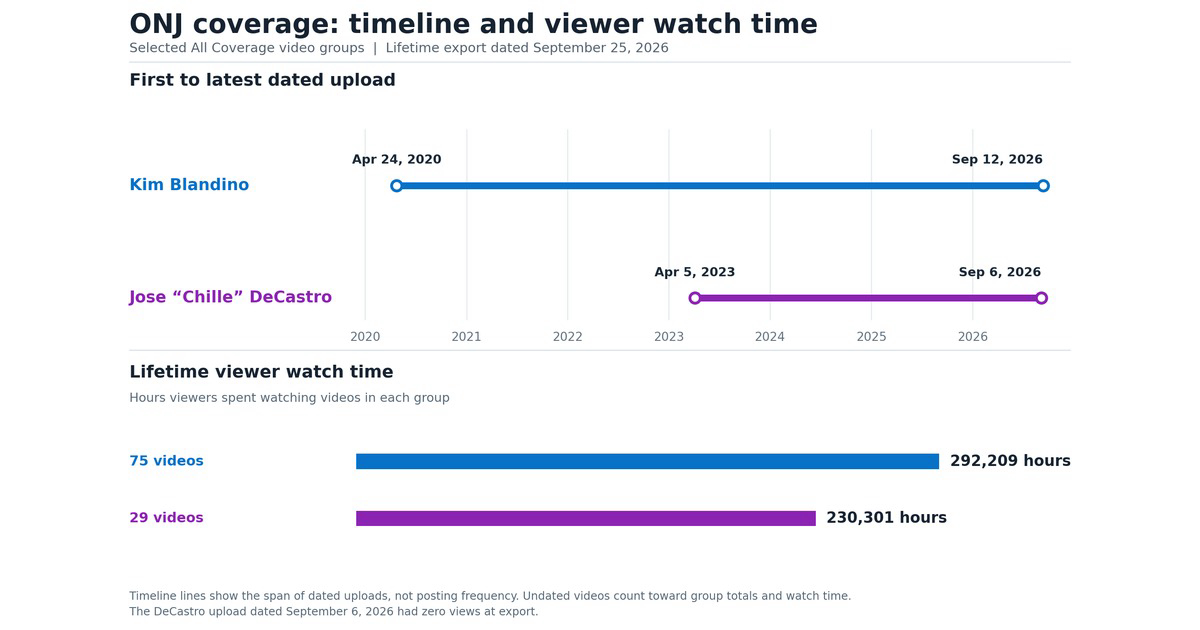
Analytical Results The earliest dated upload in the selected Blandino group is from April 2020; the earliest in the DeCastro group is from April 2023. The selected video groups contain 75 Blandino videos and 29 DeCastro videos. Although the Blandino group contains more than twice as many videos, their lifetime viewer watch time is closer: approximately 292,209 hours for Blandino and 230,301 hours for DeCastro. These figures measure time viewers spent watching, rather than the combined length of the videos. 2. How has viewer interest in Blandino and DeCastro coverage changed over time? Lifetime totals and recent viewing describe different aspects of audience interest. The summary compares both, and the monthly trend shows when viewing was concentrated.
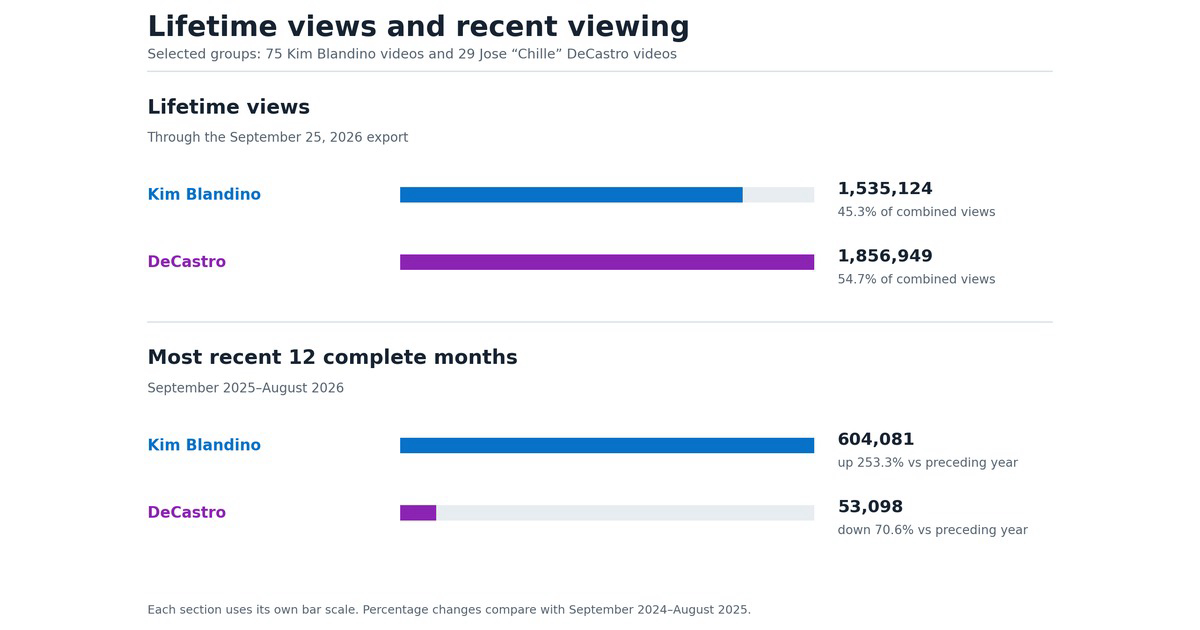
Analytical Results DeCastro coverage has received 1,856,949 lifetime views, compared with 1,535,124 for Blandino. DeCastro’s larger lifetime total reflects substantial viewing during its earlier surge. From September 2025 through August 2026, Blandino generated 604,081 views, compared with DeCastro’s 53,098—about 11.4 times as many. Relative to the preceding 12 months, Blandino views rose 253.3% and DeCastro views fell 70.6%. The most recent complete year therefore shows a different pattern of viewing than the lifetime totals.
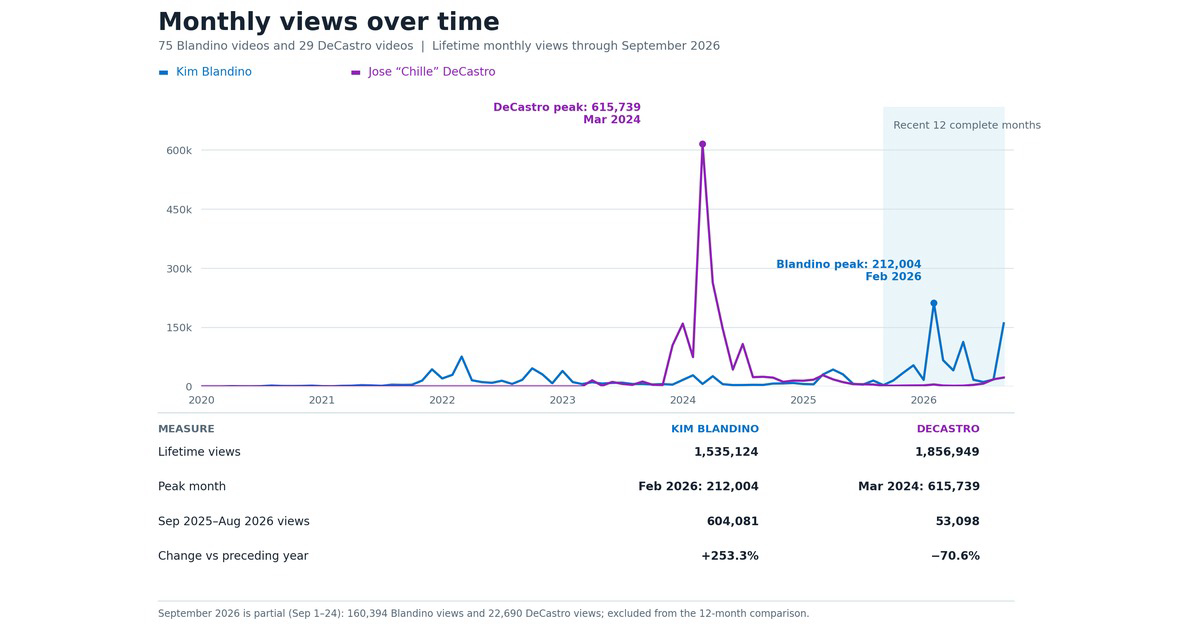
Analytical Results Blandino viewing increased sharply beginning in late 2025 and peaked at 212,004 views in February 2026. DeCastro’s largest period of viewing was December 2023 through July 2024, with a peak of 615,739 views in March 2024. During the partial month of September 2026 through September 24, Blandino recorded 160,394 views and DeCastro recorded 22,690. Those partial-month figures are excluded from the September 2025–August 2026 comparison. 3. Which individual videos generated the most viewer interest? The chart shows average viewing duration for each video; the analysis below adds watch-time context.
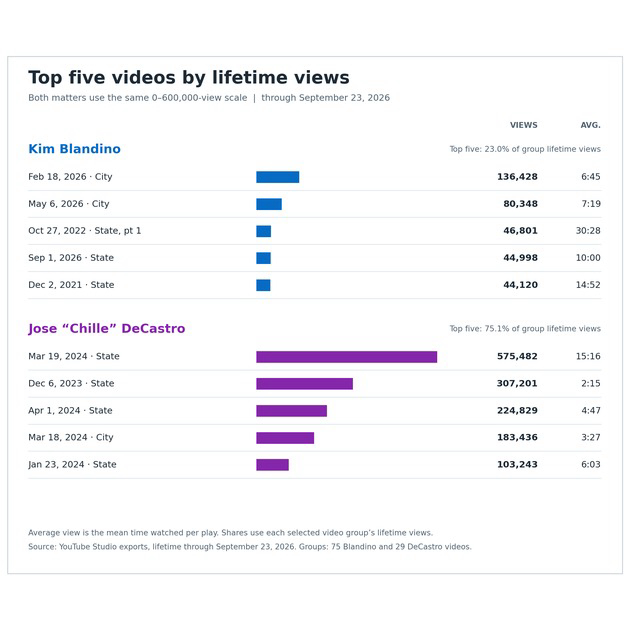
Analytical Results DeCastro’s March 19, 2024, hearing leads both groups with 575,482 lifetime views, 146,190 watch hours, and an average viewing duration of 15 minutes and 16 seconds. Its December 6, 2023, video received 307,201 views, but its average viewing duration was 2 minutes and 15 seconds. The leading Blandino video, from February 18, 2026, received 136,428 views. A Blandino hearing from October 27, 2022, received fewer views—46,801—but generated 23,731 watch hours and an average viewing duration of 30 minutes and 28 seconds. Views and watch time therefore highlight different videos. The five leading videos generated 75.1% of the DeCastro group’s lifetime views, compared with 23.0% for the updated Blandino group. Viewing was more concentrated among DeCastro’s leading videos and spread across more of the Blandino videos. 4. How did viewers discover the coverage? The graphic compares traffic sources for the two matters and shows the viewing time associated with each source.
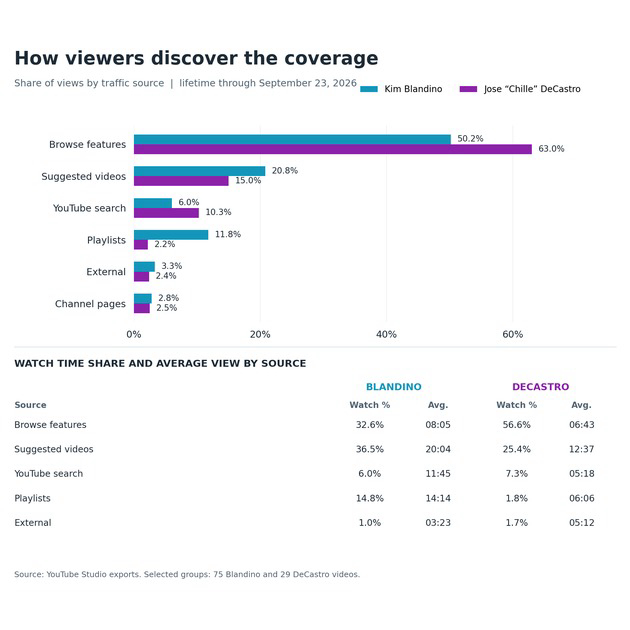
Analytical Results Browse features and Suggested videos generated 71.0% of Blandino views and 78.0% of DeCastro views. DeCastro received a larger share from Browse features (63.0% versus 50.2%) and YouTube Search (10.3% versus 6.0%). For Blandino, Suggested videos accounted for 20.8% of views but 36.5% of watch time. Playlists accounted for 11.8% of views and 14.8% of watch time. Average viewing duration was 20 minutes and 4 seconds from Suggested videos and 14 minutes and 14 seconds from Playlists. These sources contributed more viewing time than their share of views alone suggests. External sites supplied 3.3% of Blandino views and 2.4% of DeCastro views. Most recorded discovery came through YouTube sources. 5. Who watched these videos in the United States? The graphic summarizes reported U.S. age and gender views for September 2025 through August 2026. The same period is used for both matters.
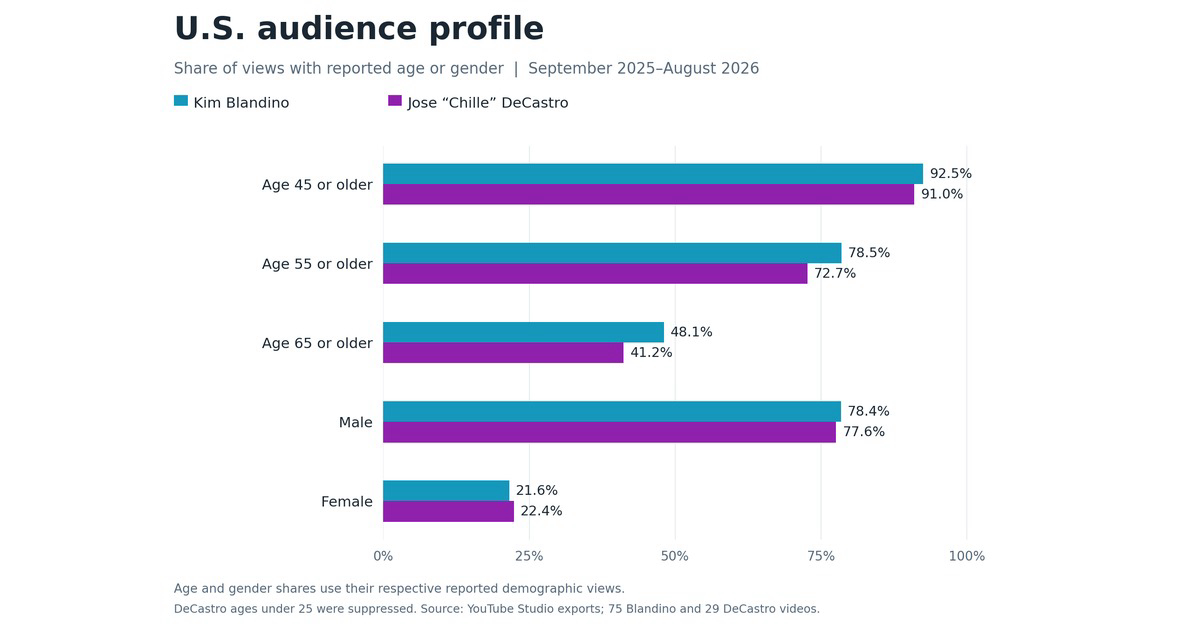
U.S. Audience Age and Gender Breakdown The two matters had similar reported U.S. age and gender profiles from September 2025 through August 2026. Among views with reported age data, people age 45 or older accounted for 92.5% of Blandino views and 91.0% of DeCastro views. The 65-and-older group was the largest for both matters: 48.1% for Blandino and 41.2% for DeCastro. Men accounted for 78.4% of Blandino views and 77.6% of DeCastro views with reported gender data. YouTube suppressed DeCastro age figures under 25 because of limited data. These figures describe viewing patterns; they do not measure viewers’ income, legal needs, or likelihood of becoming clients. 6. How strongly did the coverage reach Nevada viewers? The graphic compares identified Nevada and California views during September 2025 through August 2026. Population adjustment helps show the relative concentration of viewing activity in each state.
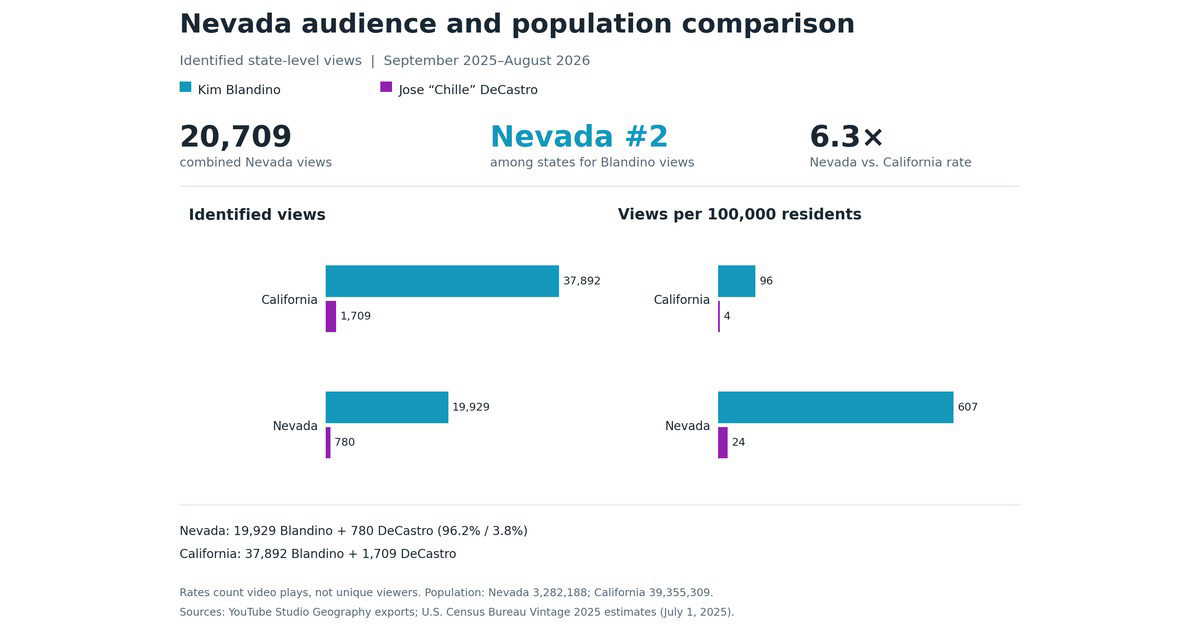
Identified Nevada Views From September 2025 through August 2026, ONJ recorded 20,709 identified Nevada views across the two video groups: 19,929 for Blandino and 780 for DeCastro. Blandino accounted for 96.2% of these Nevada views. Nevada ranked second among states for Blandino viewing and fourth for DeCastro. Analytical Results California recorded 39,601 combined views compared with Nevada’s 20,709. Because California has a much larger population, raw state totals alone obscure the relative concentration of viewing activity. The combined rate was about 631 views per 100,000 Nevada residents compared with 101 per 100,000 California residents, or roughly 6.3 times as much viewing activity after adjusting for population. This is a rate of views, not a percentage of residents reached. A person may view more than one video or watch the same video more than once; YouTube does not provide a unique Nevada viewer count in these figures.
September 2025-August 2026
Joanna Ronchi, Data Scientist;
Sep 21, 2026, 11:00 PM
Our Nevada Judges, Inc. ('ONJ') provides the public with direct access to Nevada court proceedings and preserves that coverage for continued public use. YouTube analytics show substantial growth in the reach and use of ONJ's court coverage from September 2025 through August 2026 compared with the preceding 12 months. Key Results 1,145,516 total views An increase of 299,958 views, or 35.5% 238,435.6 hours watched An increase of 107,499.8 hours, or 82.1% 12 minutes and 29 seconds per view An increase of 3 minutes and 12 seconds, or 34.4% 1,729 net subscribers gained An increase of 465 subscribers, or 36.8% 835,787 views from nonsubscribers An increase of 264,112 views, or 46.2% 351,775 views from Suggested videos An increase of 180,965 views, or 106.0% Continuing Public Value ONJ's growth extended beyond its existing subscriber audience. Nonsubscribers generated 73.0% of channel views during 2025–2026, demonstrating that the coverage reached members of the broader public. YouTube's Browse features and Suggested videos generated 843,784 views, showing that ONJ content became increasingly discoverable within the platform. ONJ's previously published videos also continued serving the public. Videos published before September 1, 2025 received 488,987 views during the following 12 months, accounting for 42.7% of all channel views. This demonstrates that ONJ functions not only as a source of timely court coverage but also as a continuing public archive of Nevada judicial proceedings. Our Nevada Judges Analytics 1. Did the public watch more ONJ content from September 2025 through August 2026 than from September 2024 through August 2025? The charts below show a substantial increase in both the amount of ONJ content watched and the time the public spent watching it.
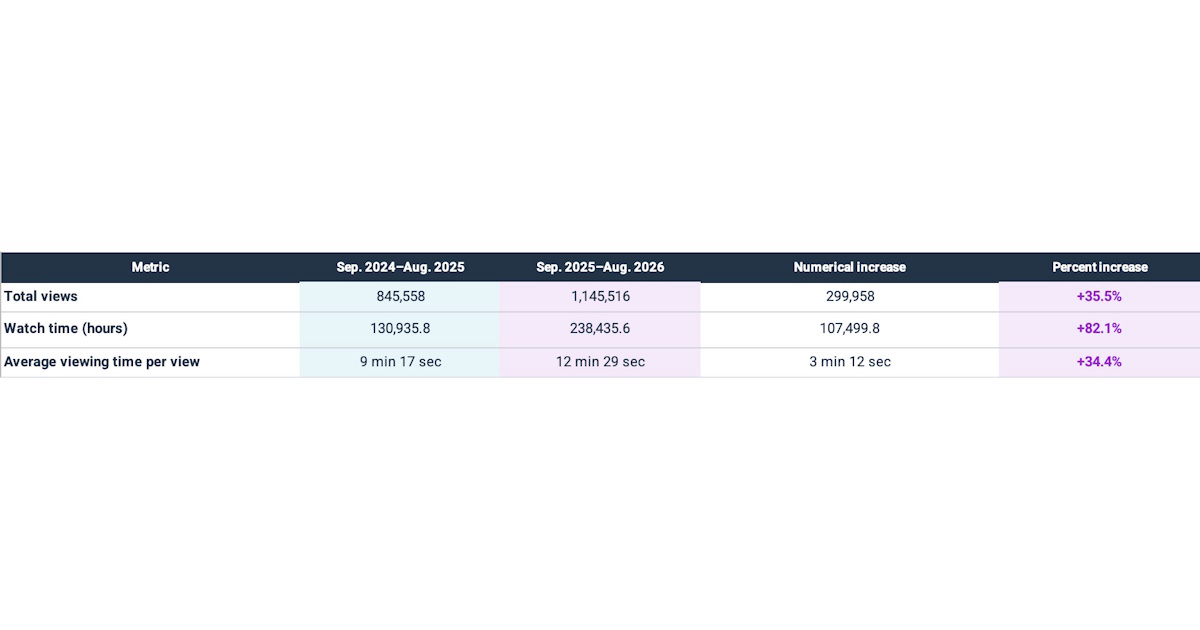
The summary table compares the two 12-month periods across three measures of public engagement. It shows that total views increased by 35.5%, total watch time increased by 82.1%, and average viewing time per view increased by 34.4%.
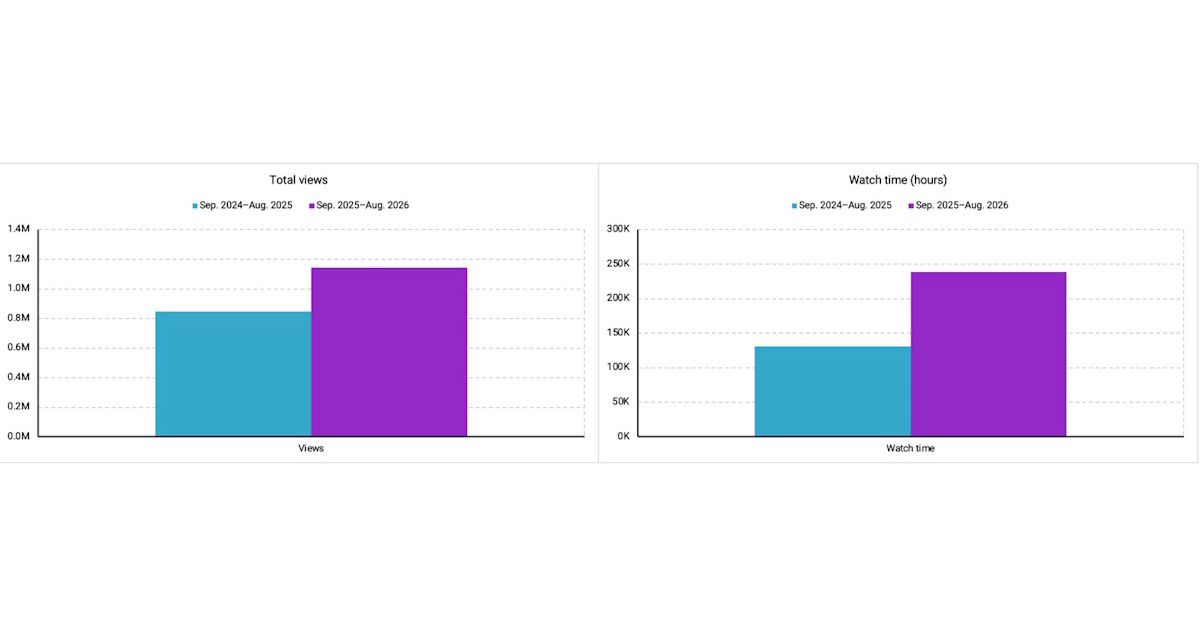
The left chart shows that ONJ content received 845,558 views from September 2024 through August 2025 and 1,145,516 views from September 2025 through August 2026. This represents an increase of 299,958 views, or 35.5%. The right chart shows that total watch time increased from 130,935.8 hours to 238,435.6 hours. This represents an increase of approximately 107,500 hours, or 82.1%. Watch time grew considerably faster than views, indicating that the public not only watched ONJ content more often but also spent more time engaging with it. Analytical Results From September 2025 through August 2026, the public watched substantially more ONJ content than during the preceding 12 months. Total views increased by 35.5%, from 845,558 to 1,145,516. Total watch time increased even more, rising by 82.1% from 130,936 hours to 238,436 hours. On average, viewers watched ONJ content for longer—approximately 12 minutes and 29 seconds per view, compared with 9 minutes and 17 seconds during the preceding year. These results show that public use of ONJ's court coverage increased substantially, both in the number of views generated and the amount of time viewers spent watching it. 2. Did ONJ gain more subscribers from September 2025 through August 2026 than during the preceding 12 months? The chart below shows that ONJ gained substantially more net subscribers during the later 12-month period. Net Subscribers Gained Chart The chart compares the number of net subscribers ONJ gained during each 12-month period. ONJ gained 1,264 net subscribers from September 2024 through August 2025 and 1,729 from September 2025 through August 2026. This represents 465 additional net subscribers, or an increase of 36.8%.
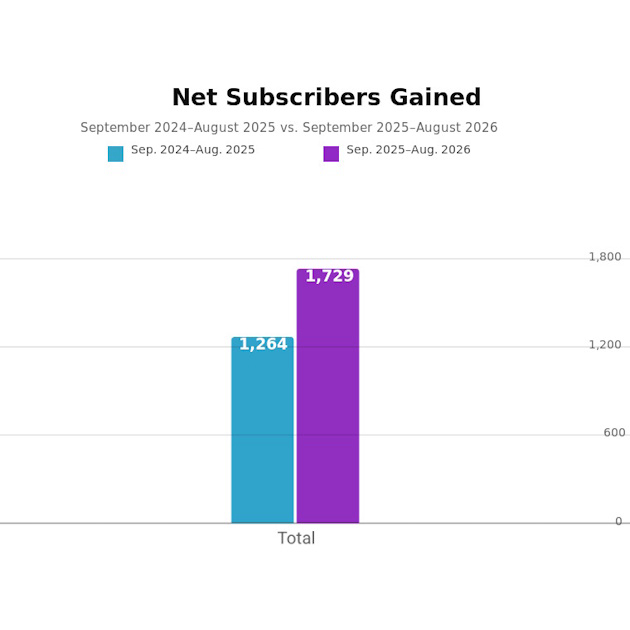
ONJ's audience continued to grow from September 2025 through August 2026. During that period, the channel gained 1,729 net subscribers, compared with 1,264 during the preceding 12 months. This represents an increase of 465 net subscribers, or 36.8%. Unlike a single video view, subscribing reflects a viewer's decision to maintain an ongoing connection with the channel and make future ONJ content easier to find. The increase therefore shows that ONJ not only attracted more viewing activity but also strengthened its continuing relationship with members of the public interested in Nevada's courts. 3. Which ONJ court proceedings generated the greatest public interest in 2024-25 and 2025-26? The charts below identify the five most-watched ONJ videos during each 12-month period and show how public interest shifted between major court proceedings.
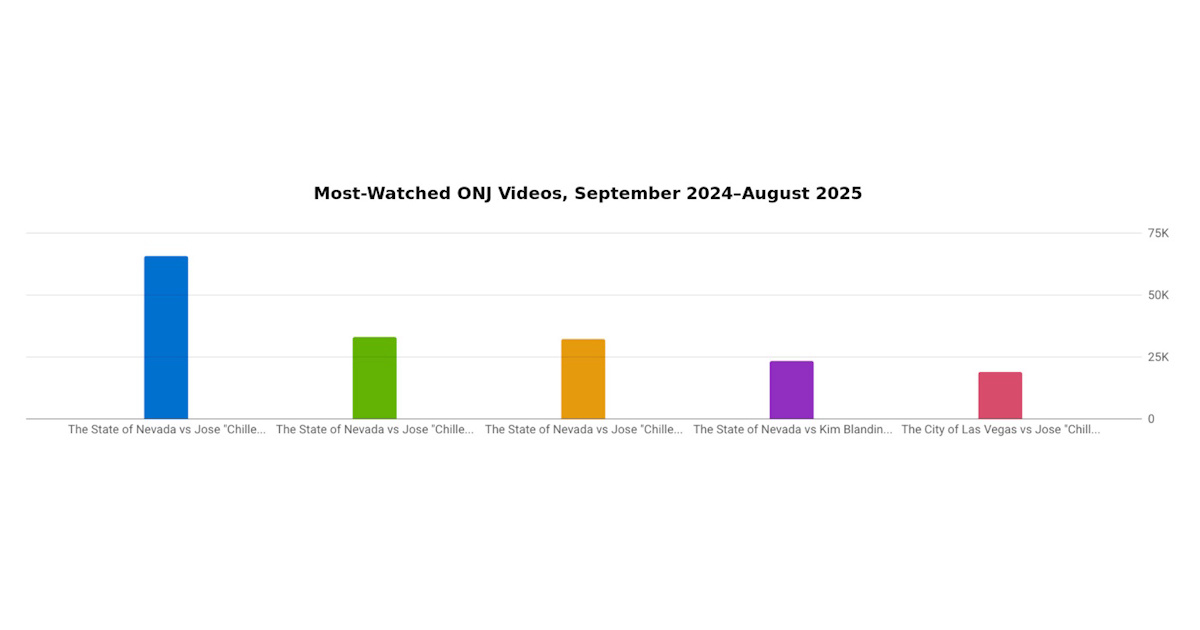
During the earlier period, proceedings involving Jose "Chille" DeCastro generated the greatest public interest. Four of the five most-watched videos involved DeCastro. The leading video, covering The State of Nevada v. Jose "Chille" DeCastro on March 19, 2024, received 65,517 views. Two additional DeCastro proceedings received 32,677 and 32,044 views. A Kim Blandino proceeding was also among the five most-watched videos, with 23,079 views.
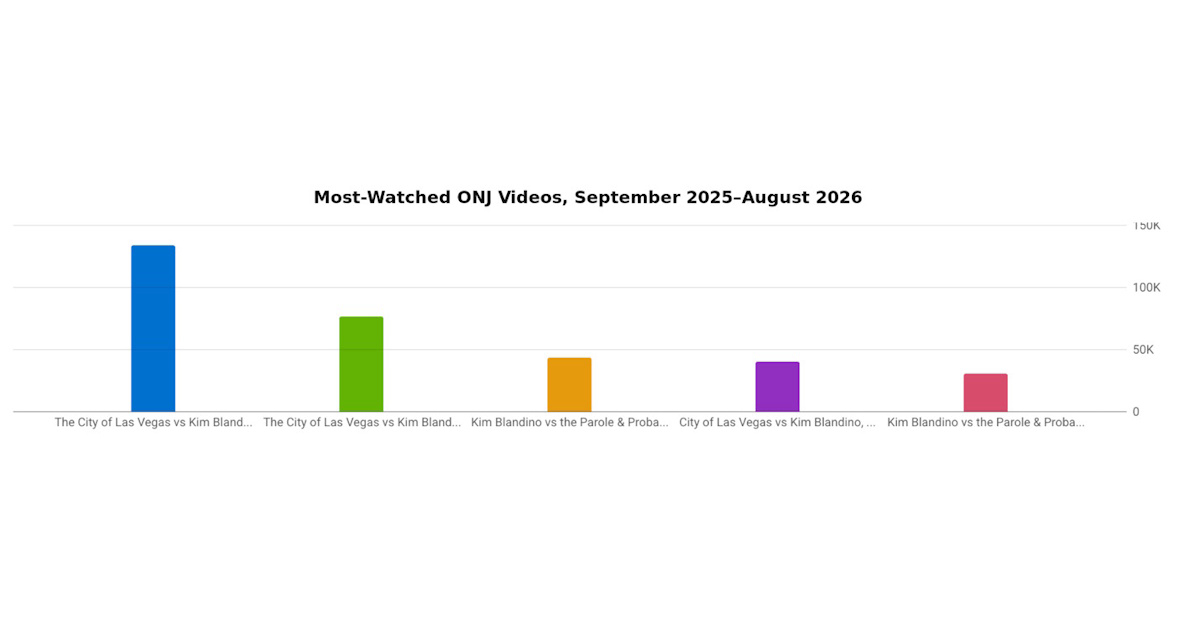
During the later period, proceedings involving Kim Blandino generated the greatest public interest. All five of the most-watched videos involved Blandino. The leading video, covering The City of Las Vegas v. Kim Blandino on February 18, 2026, received 133,175 views. Another Blandino proceeding received 76,446 views, while the remaining three leading videos received 43,101, 40,245 and 29,906 views. Analytical Results The results show that ONJ attracts substantial public interest in active and closely followed Nevada court proceedings. Public attention shifted from the DeCastro proceedings in 2024–2025 to the Blandino proceedings in 2025–2026. The most-watched video in the later period received 133,175 views, more than twice the 65,517 views received by the leading video in the preceding year. Together, the five most-watched videos from September 2025 through August 2026 received 322,873 views. These results demonstrate substantial public demand for timely access to significant Nevada court proceedings and ONJ's ability to provide coverage when public interest is highest. 4. How did members of the public find ONJ's court coverage? The chart below compares the primary ways viewers found ONJ content during the two 12-month periods.
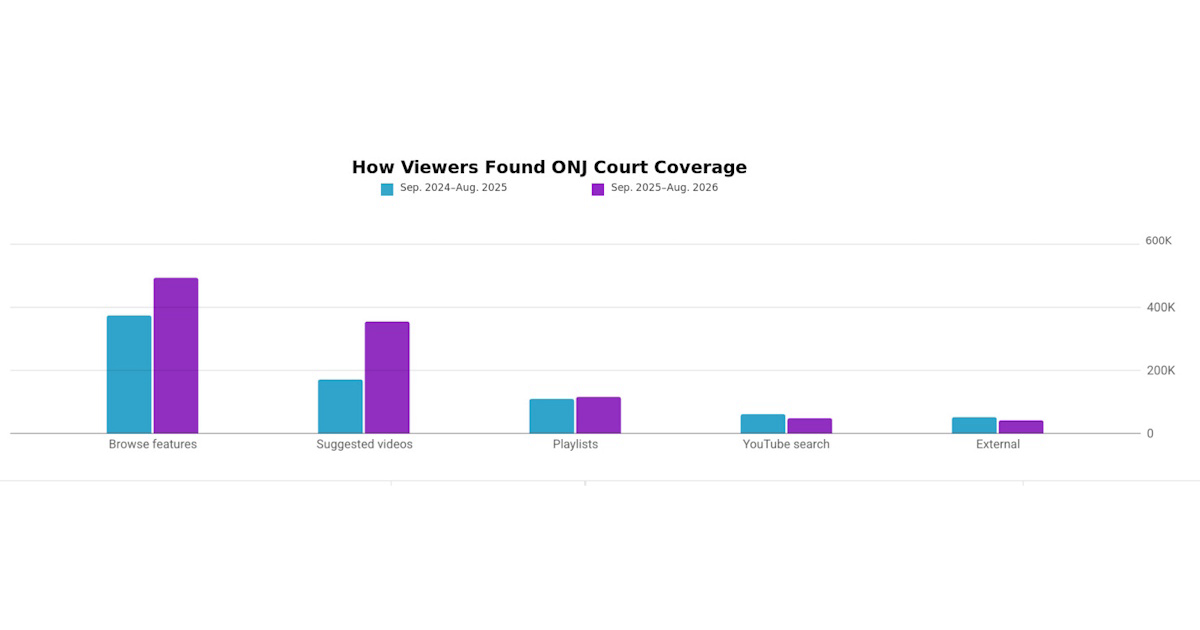
Browse features were ONJ's largest traffic source in both periods, increasing from 373,914 views to 492,009 views, or 31.6%. Views from Suggested videos more than doubled, increasing from 170,810 to 351,775, or 106.0%. Views originating from playlists also increased slightly, from 108,964 to 114,230. YouTube search decreased from 60,392 to 48,320 views, while external traffic decreased from 50,713 to 39,346 views. Analytical Results ONJ's growth was driven primarily by YouTube recommending its court coverage to viewers. Browse features and Suggested videos generated a combined 544,724 views from September 2024 through August 2025. That number increased to 843,784 views during the following 12 months, an increase of 299,060 views, or 54.9%. These two sources accounted for approximately 64.4% of reported traffic in the earlier period and 73.8% in the later period. This indicates that ONJ's content became more discoverable within YouTube and was increasingly presented to viewers based on their interests and viewing activity. The growth was therefore not dependent on outside websites or viewers already knowing what to search for. YouTube itself increasingly connected members of the public with ONJ's Nevada court coverage. 5. Did ONJ reach members of the public who were not already subscribed to the channel? The chart below compares views from subscribers and nonsubscribers during the two 12-month periods. It shows that ONJ received substantially more views from people outside its existing subscriber audience.
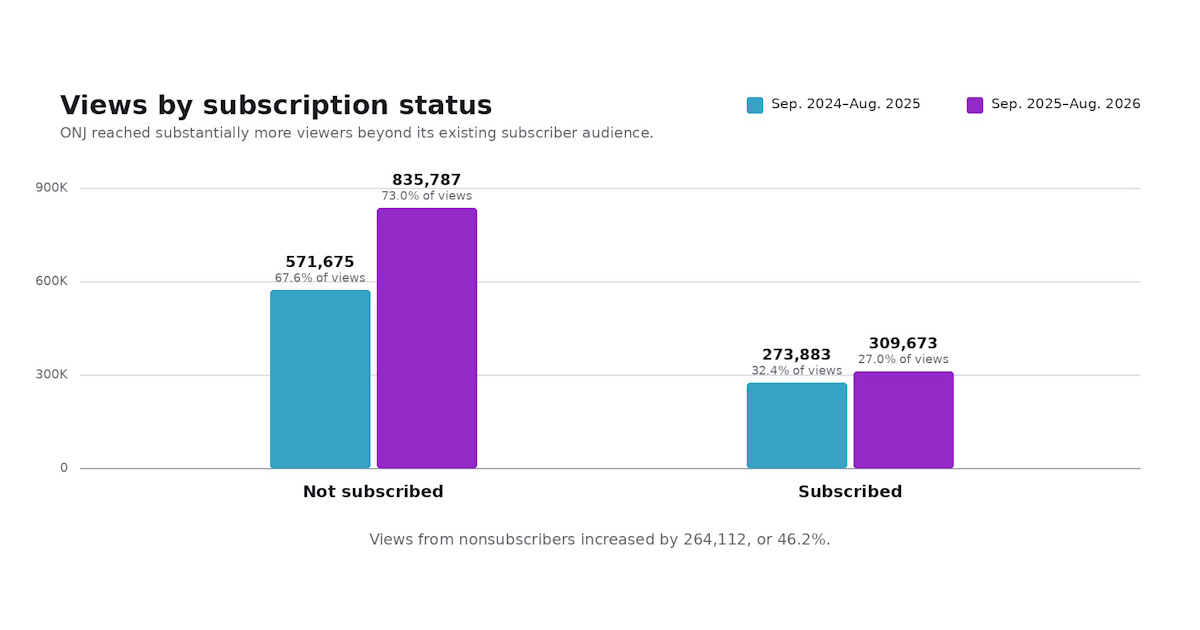
Views from nonsubscribers increased from 571,675 during September 2024 through August 2025 to 835,787 during September 2025 through August 2026. This represents an increase of 264,112 views, or 46.2%. Views from subscribers also increased, rising from 273,883 to 309,673, an increase of 35,790 views, or 13.1%. Analytical Results Most ONJ views came from people who were not subscribed to the channel. Nonsubscribers accounted for 67.6% of views during the earlier period and 73.0% during the later period. This means ONJ's growth was not limited to its established followers. Its court coverage increasingly reached members of the broader public, demonstrating expanded public awareness of and access to ONJ content. 6. Did ONJ's videos continue educating the public after they were originally published? The chart below shows how much of ONJ's viewership during September 2025 through August 2026 came from videos published before that period began. It demonstrates that ONJ's existing collection of court coverage continued attracting substantial public interest.
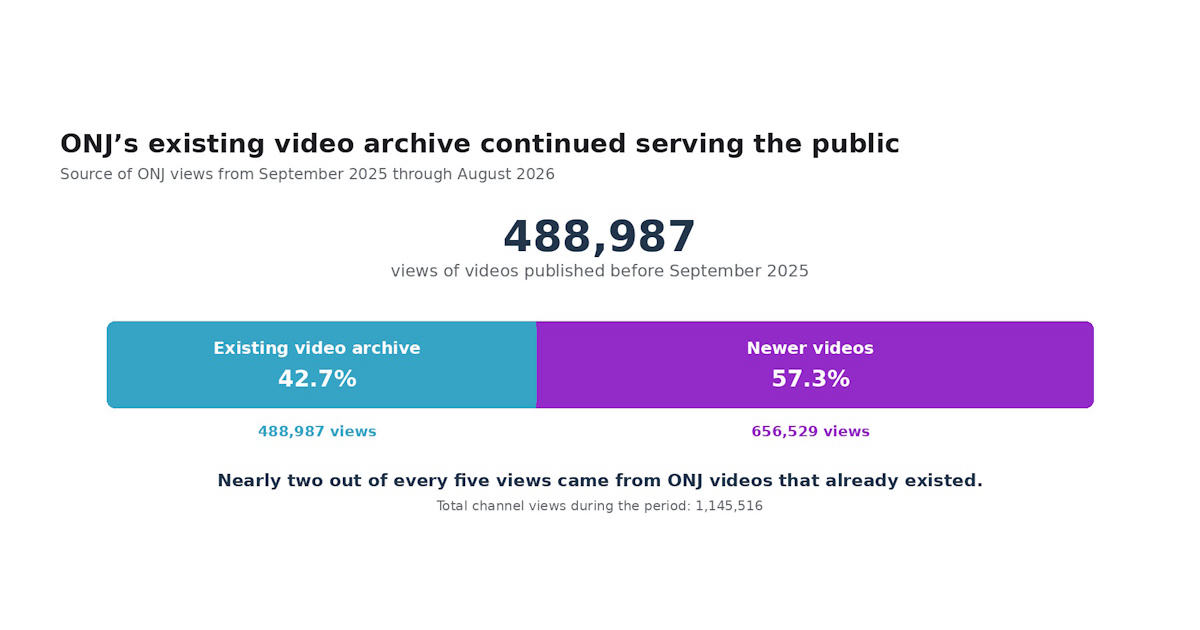
Videos published before September 1, 2025 received 488,987 views during September 2025 through August 2026. These previously published videos accounted for 42.7% of the channel's 1,145,516 total views during the period. Newer videos published during September 2025 through August 2026 generated the remaining 656,529 views, or 57.3% of the total. Analytical Results More than two out of every five ONJ views during 2025–2026 came from videos that had already been published. This demonstrates that ONJ's court coverage continues providing public value beyond the initial interest surrounding a proceeding. The channel functions as an ongoing public archive where viewers can access and revisit Nevada court proceedings after their original publication. 7. How much time did the public spend watching ONJ's court coverage, and how did that change? The table and chart below show how much time the public spent watching ONJ content during the two 12-month periods. Watch time provides an important measure of public use because it reflects the total time viewers spent with the content, rather than simply counting how often a video was opened.
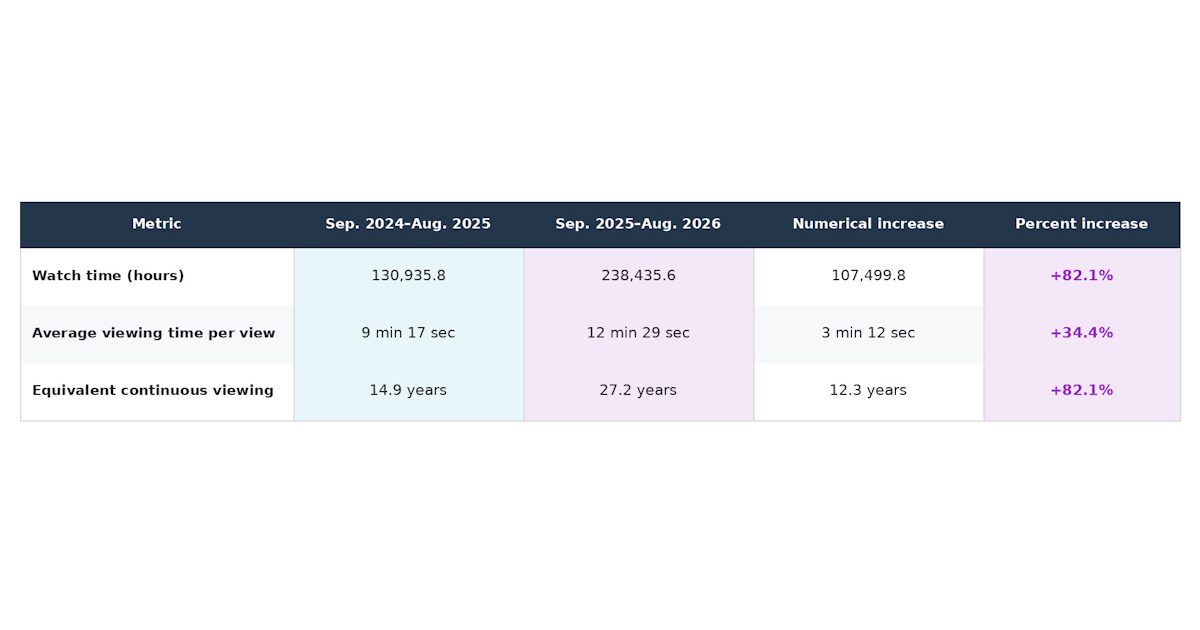
From September 2024 through August 2025, ONJ generated 130,935.8 hours of public viewing. From September 2025 through August 2026, watch time increased to 238,435.6 hours. This represents an increase of 107,499.8 hours, or 82.1%. Average viewing time also increased from approximately 9 minutes and 17 seconds to 12 minutes and 29 seconds per view. This represents an increase of 3 minutes and 12 seconds, or 34.4%.
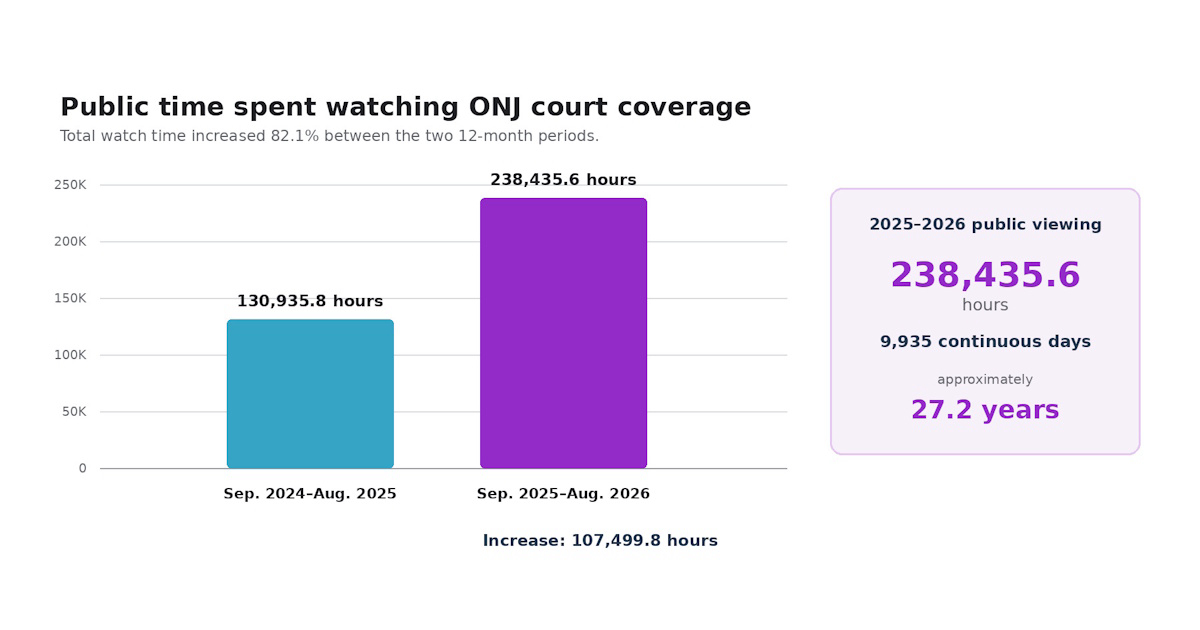
The chart shows the increase in total watch time between the two periods. The 130,935.8 hours recorded during 2024–2025 were equivalent to approximately 14.9 continuous years of viewing. During 2025–2026, that figure increased to 238,435.6 hours, equivalent to approximately 9,935 continuous days—or 27.2 years of viewing accumulated in a single year. The increase alone—107,499.8 additional hours—is equivalent to approximately 12.3 continuous years of public viewing. Analytical Results The public devoted substantially more time to ONJ's court coverage during September 2025 through August 2026 than during the preceding 12 months. This growth occurred because ONJ received more views and viewers also spent more time watching per view. Watch time demonstrates actual and sustained use of ONJ's work. Viewers did not merely encounter or briefly open the videos. They collectively spent 238,435.6 hours accessing Nevada court proceedings and related coverage. The public follows ONJ's court coverage extensively, and the coverage allows members of the public to observe Nevada's judicial system.
Factors Associated with Disposition Timing in Appellate Courts
Joanna Ronchi, Data Scientist;
Jun 19, 2026, 9:00 AM
Research Question To what extent do observable case characteristics explain variation in appellate disposition timing? Null Hypothesis Observable case characteristics, including appellate court assignment, case type, outcome group, and proper-person status, are not significantly associated with appellate disposition timing. Alternative Hypothesis At least one observable case characteristic, including appellate court assignment, case type, outcome group, or proper-person status, is significantly associated with appellate disposition timing. Context Nevada's appellate court system changed in 2014, when the legislature created the Nevada Court of Appeals. Before 2014, the Nevada Supreme Court handled all appeals filed in the state. The Court of Appeals was established to help manage increasing caseloads and improve the timely resolution of appeals (Clark County Bar Association, 2025). Because appellate decisions affect litigants, families, businesses, and the government while legal disputes are pending, understanding appellate timing remains an important operational and public policy concern. Nevada appellate courts hold extensive public records, including filing dates, disposition dates, case classifications, and appellate outcomes. These records provide an opportunity to examine how appeals move through the judicial system and whether certain case characteristics are associated with longer or shorter disposition periods. Although these records are publicly available, they are not organized for large-scale analytical evaluation. As a result, relatively little empirical information exists regarding the factors associated with appellate disposition timing. Recently, the Nevada Supreme Court issued a 2026-2028 Strategic Plan identifying predictive analytics, workload planning, and performance management as important priorities for the state's judiciary (Nevada Judiciary, 2026). Studying the timing of appellate dispositions provides an opportunity to understand how appeals move through the system and whether certain case characteristics are consistently associated with longer or shorter timelines. Data Sources The Nevada Judiciary provides public access to individual appellate case records through its online case management system. However, the system functions primarily as a case-by-case search tool and does not provide a downloadable statewide dataset suitable for analysis. The dataset used in this study was collected from publicly available records maintained by the Nevada Supreme Court and the Nevada Court of Appeals (Nevada Judiciary, n.d.,-b). Because no single statewide dataset existed that contained the information needed to evaluate appellate disposition timing, the workflow constructed a custom dataset by collecting and integrating records from multiple appellate sources. The four primary collections included: 2023-2026 Published Nevada Supreme Court Dispositions, 2023-2026 Unpublished Nevada Supreme Court dispositions, 2023-2026 Published Nevada Court of Appeals opinions, 2023-2026 Unpublished Nevada Court of Appeals dispositions. Each appellate record contained information about the filing, disposition, classification, outcome, and procedural history of the case. Combining records from the Nevada Supreme Court and Court of Appeals produced a statewide dataset for analysis. The public appellate case records offered an opportunity to examine how cases move through Nevada's appellate system. Because the records contained detailed information about individual appeals, including initial filing and final disposition dates, they supported analyses of disposition timing, final case outcomes (including orders and opinions), court assignment, and other characteristics that may influence how long a case remains pending. The resulting dataset provided a statewide view of appellate case processing across both appellate courts. Challenges of the Chosen Data Collection Method A major advantage of this methodology was flexibility. Collecting data directly from court records enabled the construction of a dataset containing variables not available in existing public reports and the evaluation of relationships among disposition timing, court assignment, case type, and appellate outcomes. Since the Nevada Judiciary does not provide a downloadable statewide dataset, which made large-scale data collection difficult. Selenium automation enabled statewide analysis by directly collecting appellate records from the case-management system and organizing them into structured datasets for analysis. The amount of time required to collect, validate, and prepare the data was a major disadvantage. Because the information originated from multiple sources and publication formats, the data collection process required substantial effort to standardize the data and ensure consistency across the statewide dataset. Data Extraction Process Because no ready-made dataset existed for this analysis, the project relied on direct collection of court records. This approach enabled combining information from multiple sources and creating variables tailored to the study. Collecting the records directly from the courts made that analysis possible. Existing public reports summarize appellate activity but do not provide the case-level information needed to examine how factors such as court assignment, case type, outcome, and representation status relate to disposition timing. The Nevada Appellate Case Management System served as the primary source of appellate records for this study. The system provides access to cases before both the Nevada Supreme Court and the Nevada Court of Appeals, including filing dates, disposition dates, case classifications, docket activity, and other procedural information. Users can locate individual appeals by searching a case number and opening the corresponding case record (Figure 1). Although the system provides detailed information for individual appeals, it does not offer a downloadable statewide dataset suitable for analysis. Researchers must retrieve records one case at a time through the search interface shown in Figure 1. Collecting thousands of appellate records manually would have made statewide analysis impractical. To address this limitation, Selenium automated the collection process and assembled the records into structured source files for further preparation and analysis.
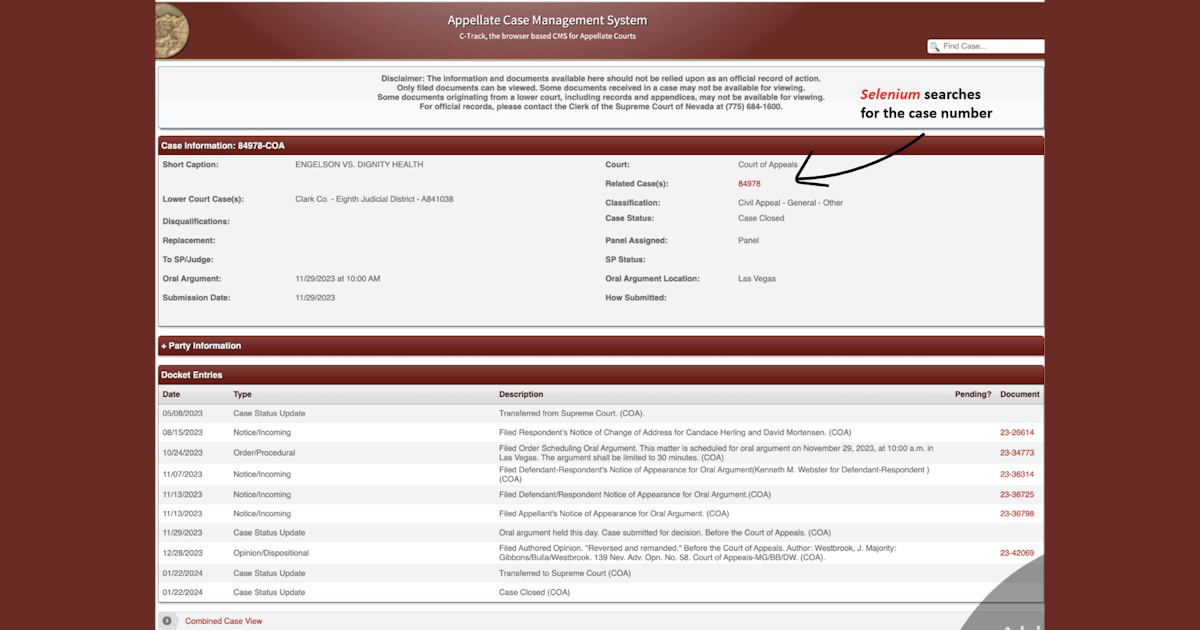
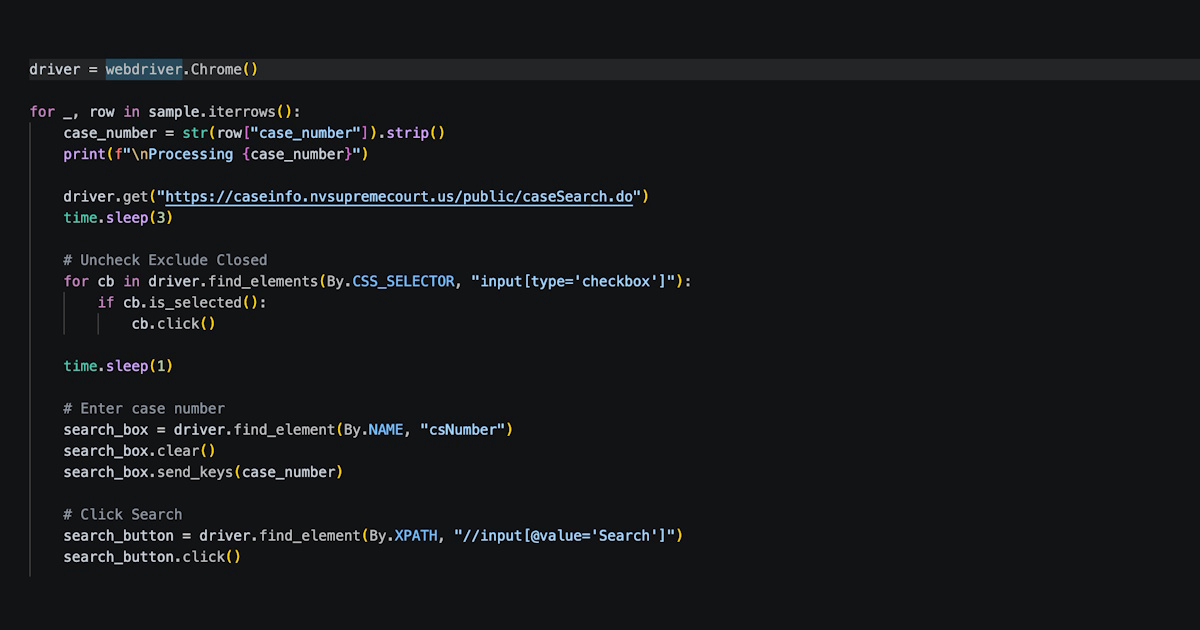
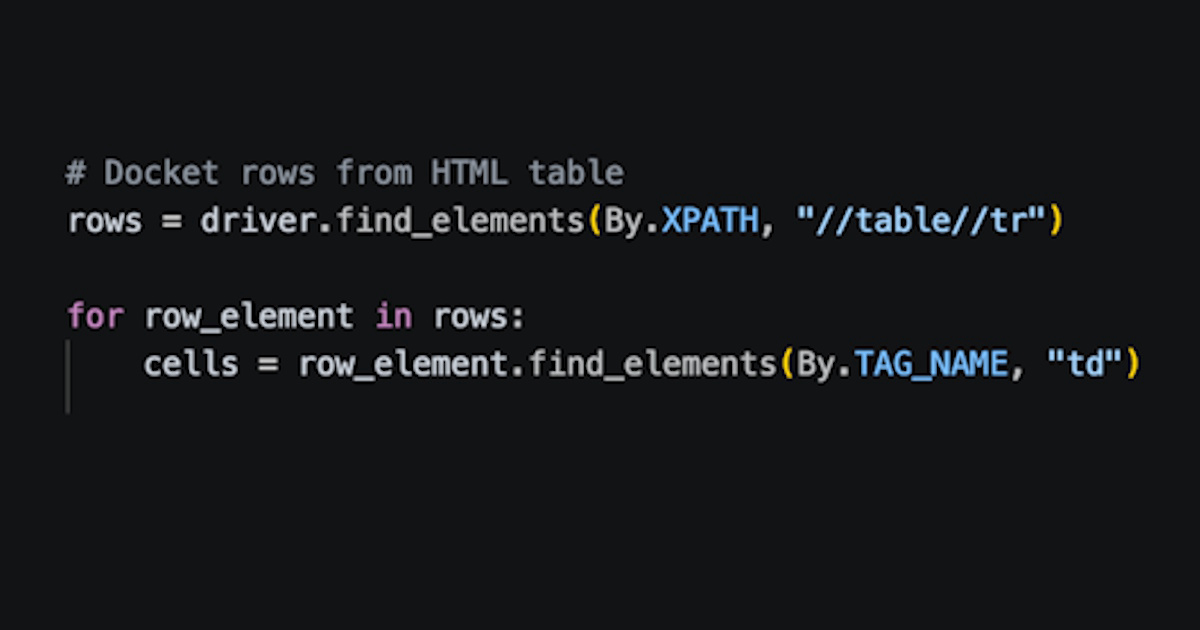
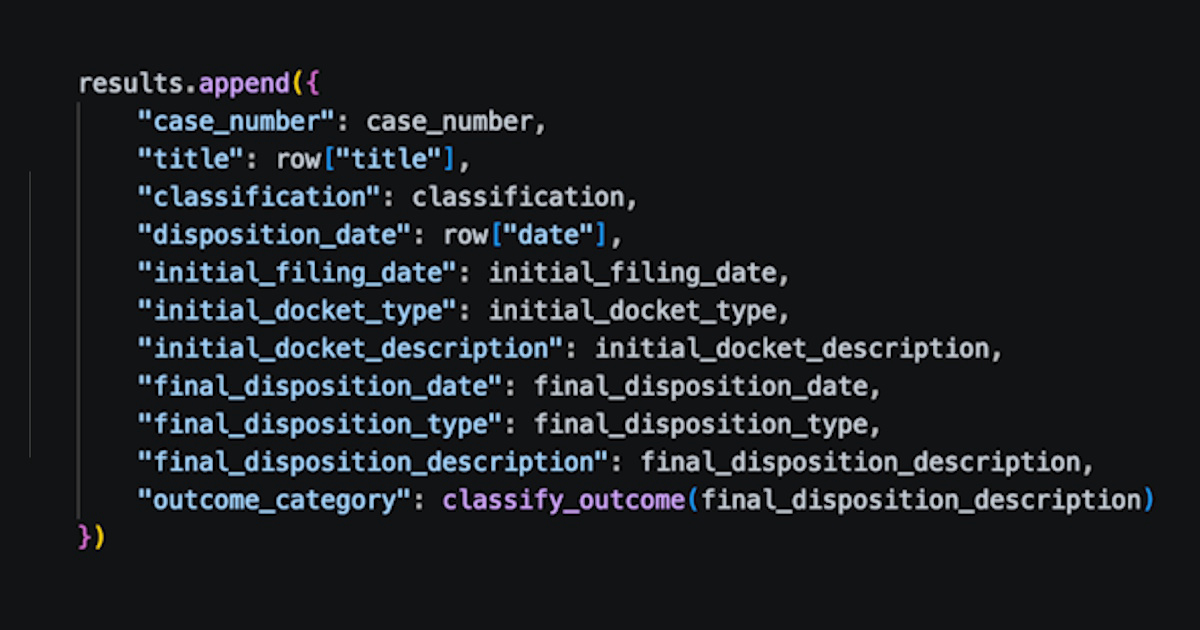
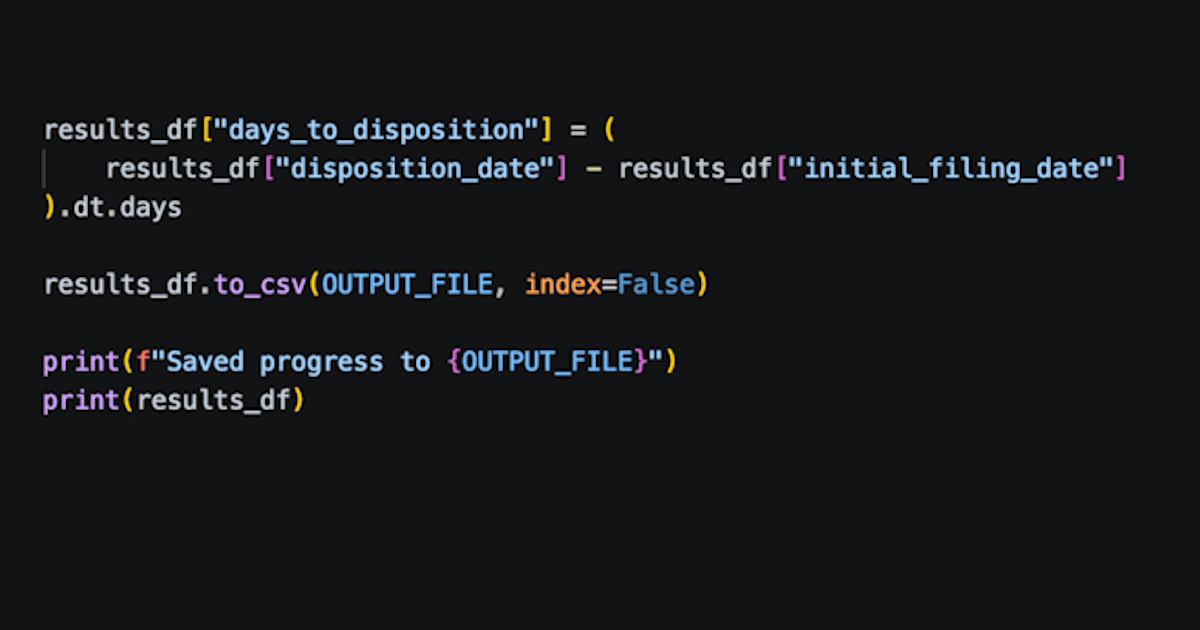
Summary of Data Extraction Selenium extracted and created more than 90 source files into four collections: Supreme Court (published and unpublished cases) and Court of Appeals (published and unpublished). Before combining these datasets, the workflow confirmed that column structures and collected variables were consistent across the collections. Figures 2A, 2B, 2C, and 2D summarize the automated workflow used to collect records from four appellate data sources. The Selenium browser automation tool enabled scraping thousands of appellate records using the same process across all four data sources (Selenium, n.d.). Without automation, assembling a statewide dataset of this size would have been impractical. For each case number, the script searched the Nevada Judiciary website and retrieved the corresponding appellate record. The process included adjusting the search settings to return complete case histories and collecting the docket information associated with each appeal. The scraping process produced CSV files containing 11 variables for each appellate record. These files served as the starting point for subsequent data preparation, validation, and integration. After Selenium extracted the appellate records, Python stored the collected information in structured CSV files and calculated disposition timing for each record (Figure 3). Additional preparation steps described later in the workflow combined these source files into a statewide dataset for analysis. Preparation of the Master Dataset Preparing the data for analysis proved more challenging than collecting the data from public records. Because the information originated from multiple courts, publication types, and file formats, it required extensive validation and standardization before combining the records into a single statewide dataset. Much of the work involved reconciling differences across sources while preserving the accuracy of the underlying appellate records. Preparing the statewide dataset nv appellate master required more than simply combining records from multiple sources. The process began with resolving duplicate case numbers and identifying the final operative disposition for each appeal. After integrating the records into a statewide master dataset, the workflow validated the data and restricted the population to appeals that received substantive merits review. The final steps involved creating analytical features and performing additional validation checks before analysis and modeling. Data validation challenges included deciding how to handle cases where a single case number appeared multiple times. At first glance, these records appeared to be duplicates (Figure 3).
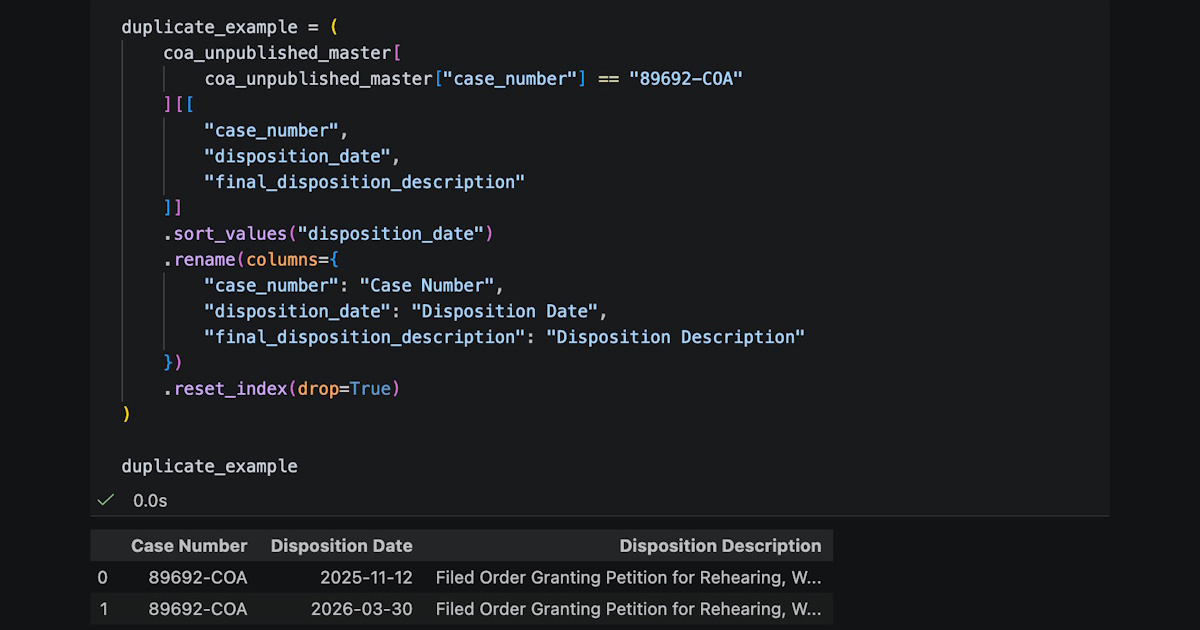
However, closer inspection revealed that many of the repeated case numbers were legitimate appellate activity and not data errors. The research question focused on how long it takes an appeal to reach a final resolution. For that reason, the analysis retained the court's final operative disposition rather than the first disposition entered in the case (Figure 4).
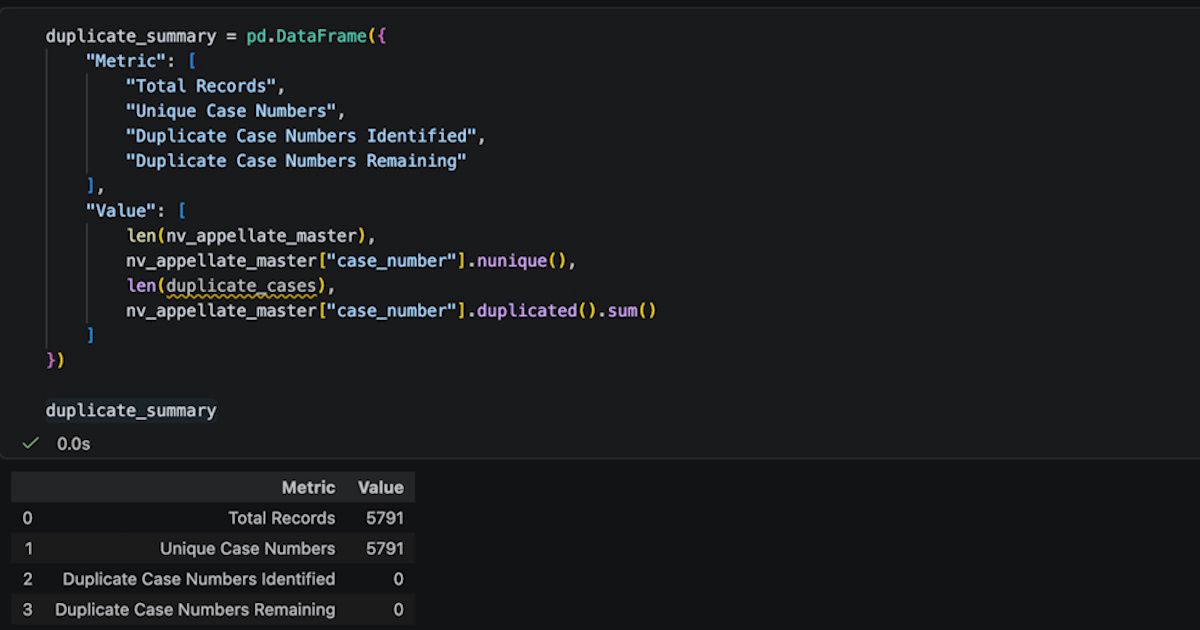
An earlier disposition does not always end an appeal, as additional orders may follow, and the parties remain involved in the appellate process until the court issues its final controlling decision (Nevada Judiciary, 2025). Using the final disposition date ensured that disposition timing reflected the full life cycle of an appeal rather than a procedural step that was later modified, amended, or replaced. Combining the four source datasets created a statewide master dataset nv appellate master.csv that served as the basis for subsequent preparation and analysis (Figure 5).
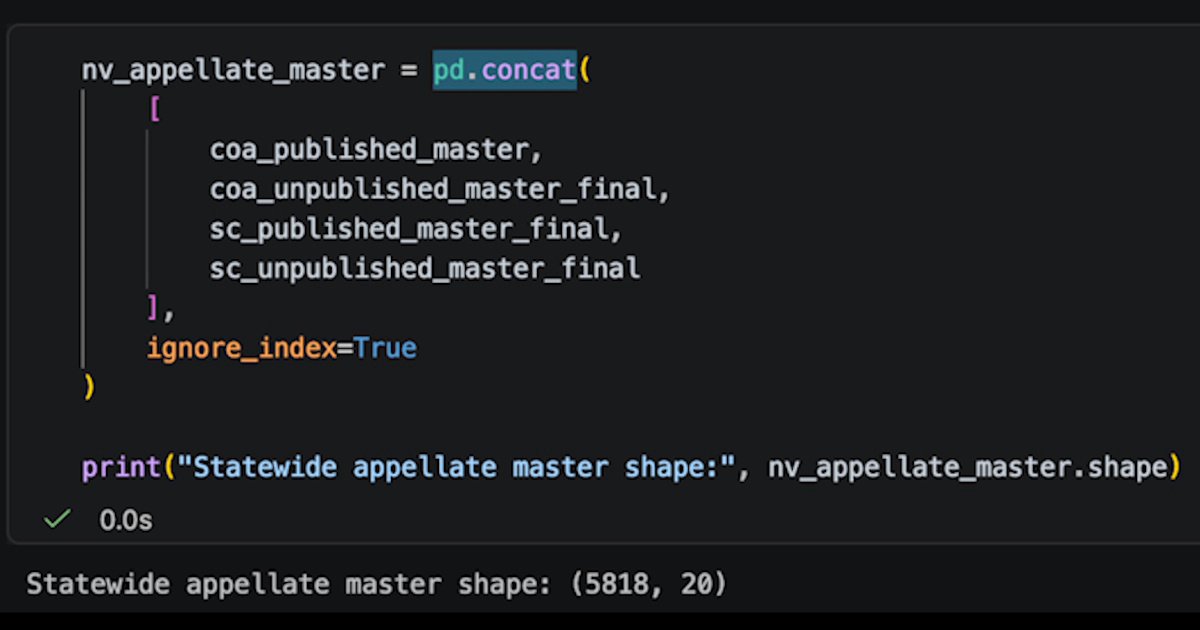
The workflow processed feature engineering in two stages. The first stage constructed the statewide master dataset and focused on preserving procedural information and standardizing records across the four source collections (Figure 6).
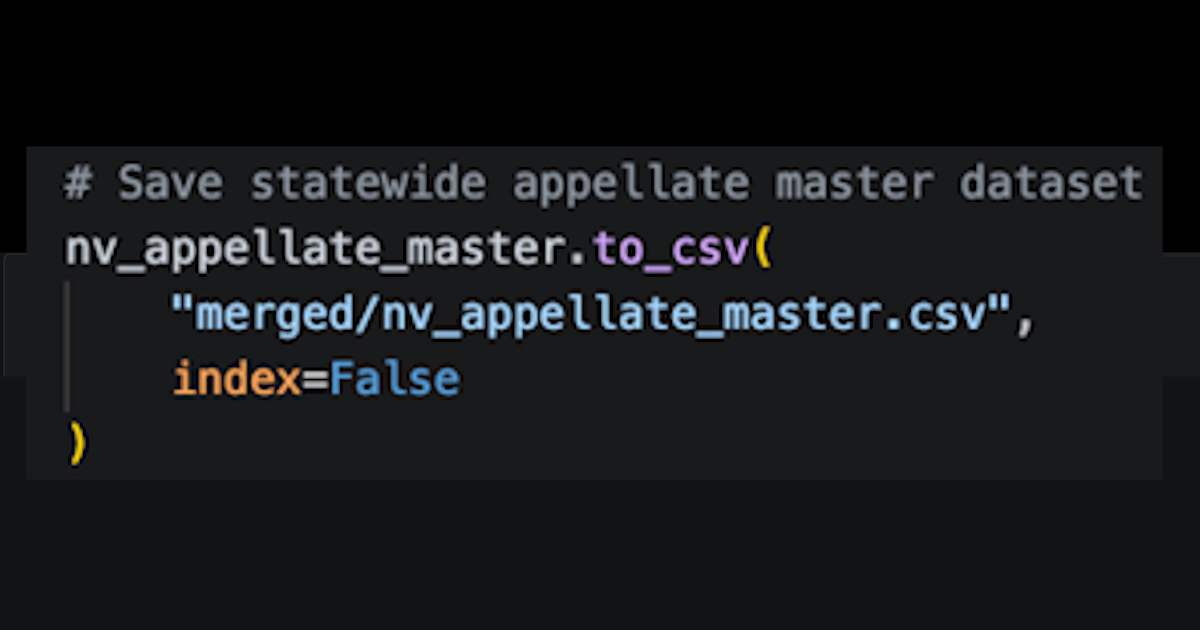
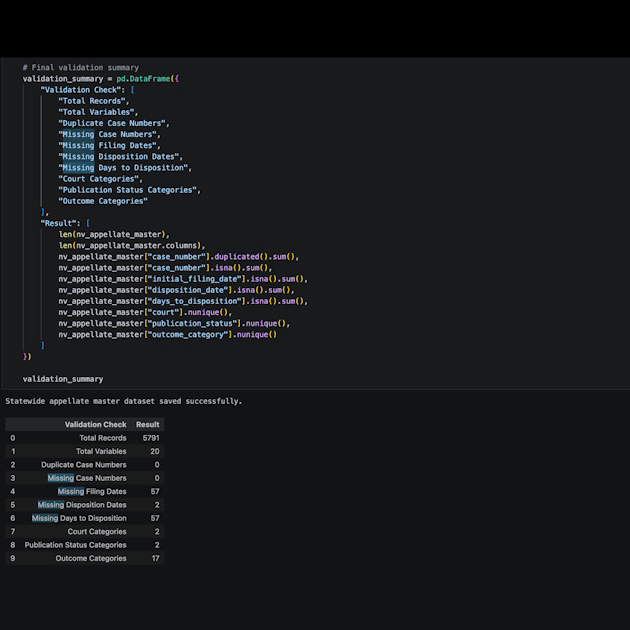
Validation of this integrated dataset identified 57 records with missing filing dates, two records with missing disposition dates, and 57 records with missing disposition-timing values (Figure 7). Because the statewide master dataset served as an intermediate integration dataset rather than the final analytical population, the workflow did not yet remove any records with missing values at this stage.
Preparation of the Final Merits-Case Dataset
Not every appellate disposition reflects a decision on the merits of a case. Because this study focused on factors associated with disposition timing among merit decisions, procedural dismissals, and other non-merit outcomes were excluded from further analysis. The resulting dataset included appeals that ended in
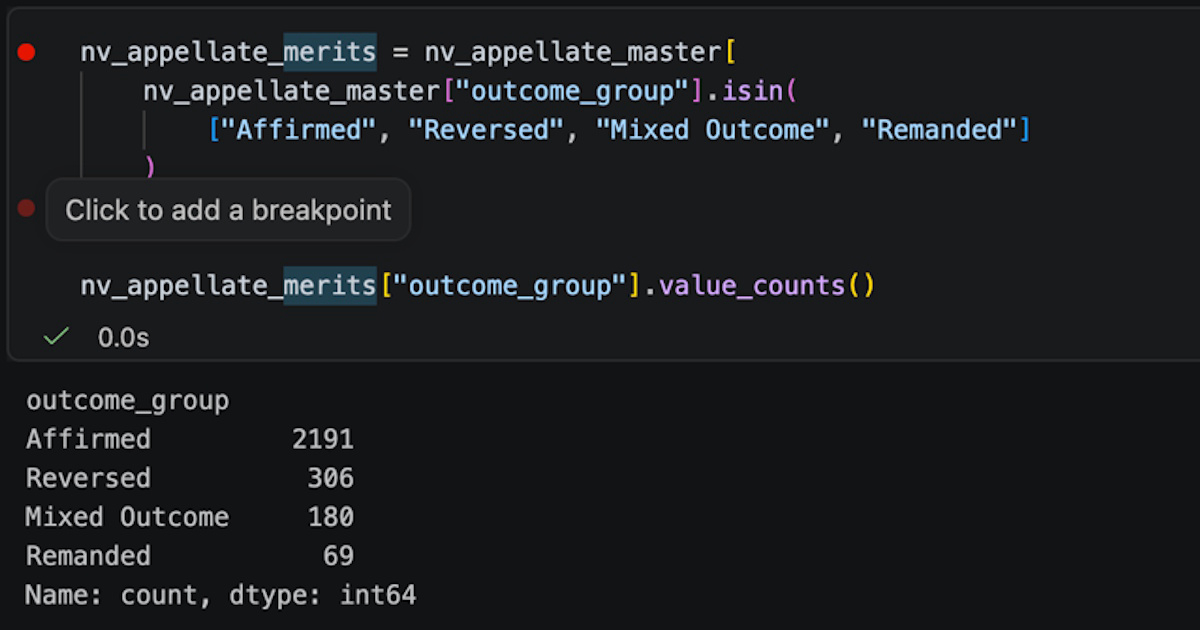
The analysis retained only appeals that ended in affirmance, reversal, mixed outcomes, or remand. After applying the filtering criteria, 2,729 appeals remained in the dataset. The study used these appeals to examine disposition timing in a multiple linear regression model, with case type, appellate court, outcome group, and proper-person status as predictors. Validation of the statewide master dataset identified 57 records with missing filing dates, two records with missing disposition dates, and 57 records with missing disposition-timing values (Figure 7). Because the statewide master dataset served as an intermediate integration dataset, the workflow retained these records at that stage. After filtering the data to appeals that received substantive merits review, none of the records containing missing values remained in the analytical population. Validation of the merits dataset confirmed that no records contained missing filing dates, disposition dates, or disposition-timing values (Figure 9). Consequently, the workflow did not require any additional missing-value treatment before exploratory analysis and predictive modeling.
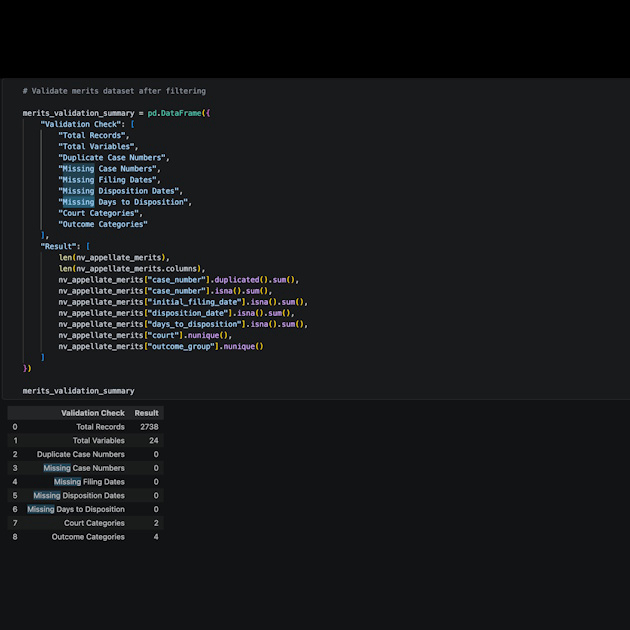
None of the missing values identified in the statewide master dataset remained in the final analytical population used for exploratory analysis and predictive modeling. With the merits dataset validated and free of missing values, the second stage of feature engineering focused on creating analytical variables for exploratory analysis and predictive modeling (Figure 10).
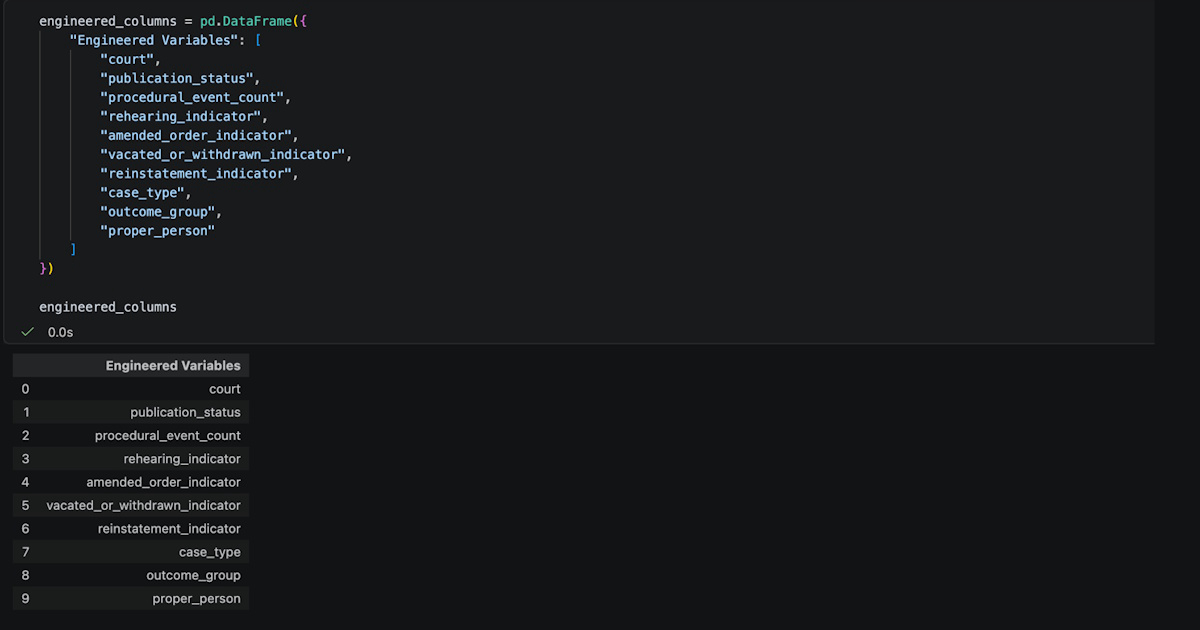
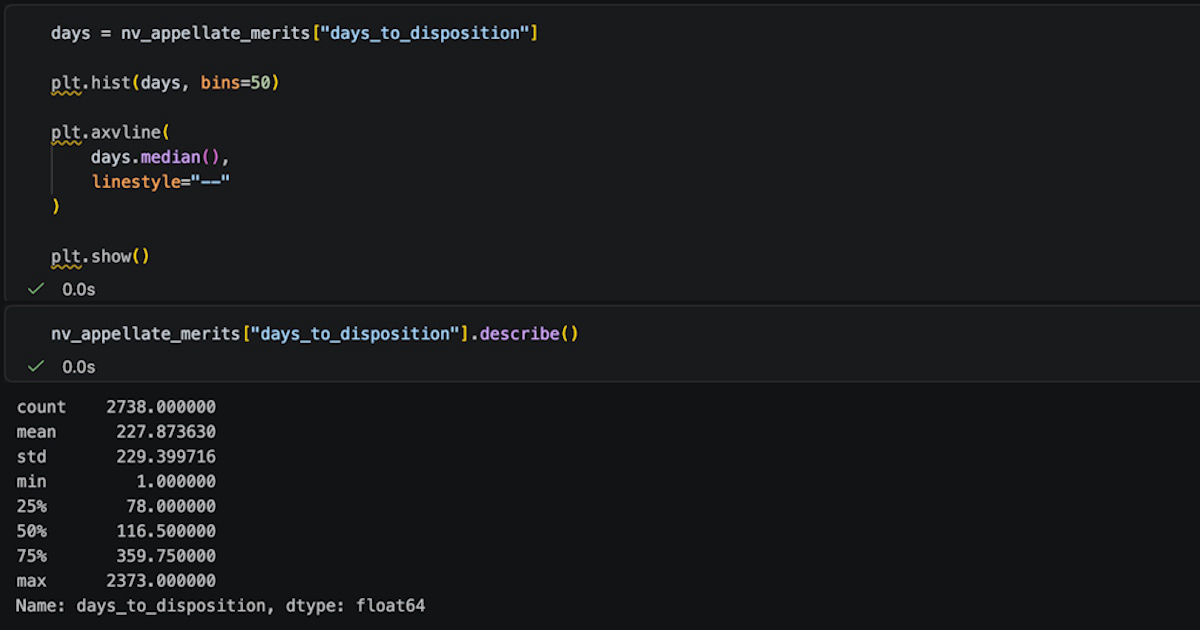
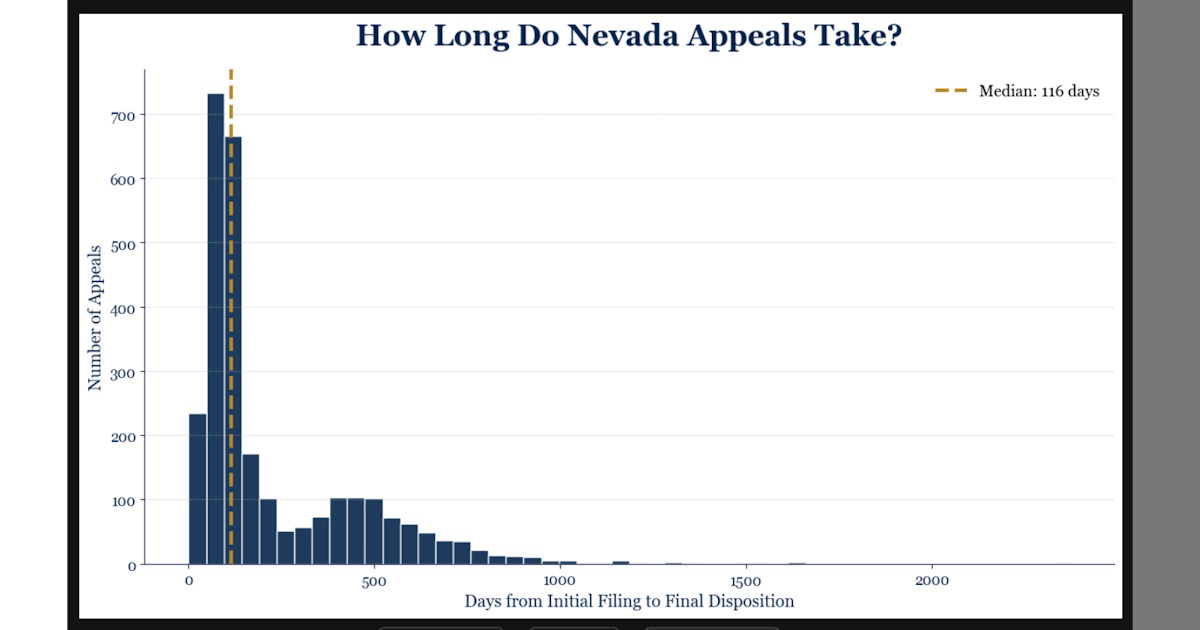
Multiple Linear Regression Analysis Multiple linear regression is appropriate in this analysis because the target variable is continuous and numeric (Montgomery et al., 2021). The model evaluated the relationships among disposition timing, case type, appellate court, outcome group, and proper-person status while accounting for the influence of the remaining variables. One strength of multiple linear regression is the capability to identify which variables have the strongest relationship with the outcome being studied (James et al., 2021). In this project, the model helped quantify differences in appellate timing across courts, case types, outcomes, and representation status. At the same time, the model could only evaluate information included in the dataset. Appellate cases move faster or slower through the judicial system for many reasons beyond the variables captured in public records. Factors such as case complexity, the scope of the record, procedural developments, legal issues raised on appeal, and overall judicial workload may similarly influence how long an appeal remains pending. Univariate Analysis The analysis first explored the merits-case dataset, one variable at a time, using summary statistics and visualizations (Tukey, 1977). Examining appellate court assignment, case type, outcome group, and proper-person status helped establish the context for the modeling phase. It revealed that some categories experienced substantially different disposition timelines than others. Days to Disposition Histogram and Descriptive Statistics The difference between the mean of 227 days and the median of 116.5 days indicates a right-skewed distribution. A small number of long-running appeals increased the overall average, with disposition times ranging from 1 to 2,373 days (Figure 11).
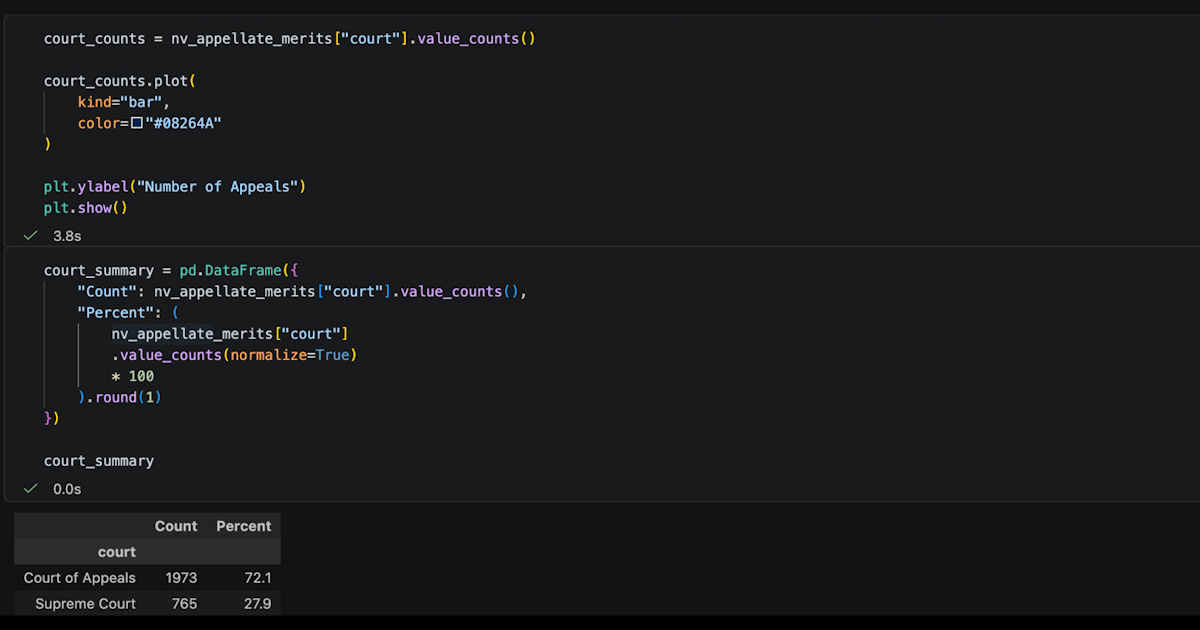
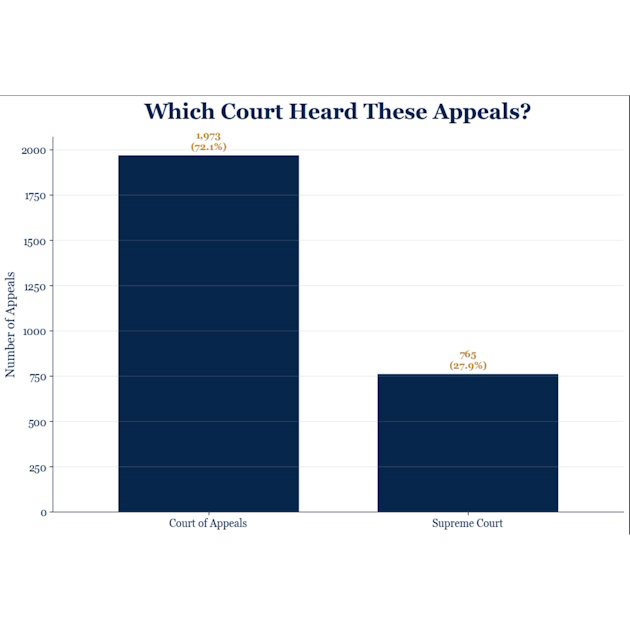
Court Type Histogram and Descriptive Statistics The Court of Appeals decided most of the merits appeals included in the study. Of the 2,729 appeals that received substantive review, 72.1% were resolved by the Court of Appeals and 27.9% by the Nevada Supreme Court. This distribution reflects the Court of Appeals' substantial role in resolving appeals within Nevada's appellate system (Nevada Judiciary, n.d.-a).
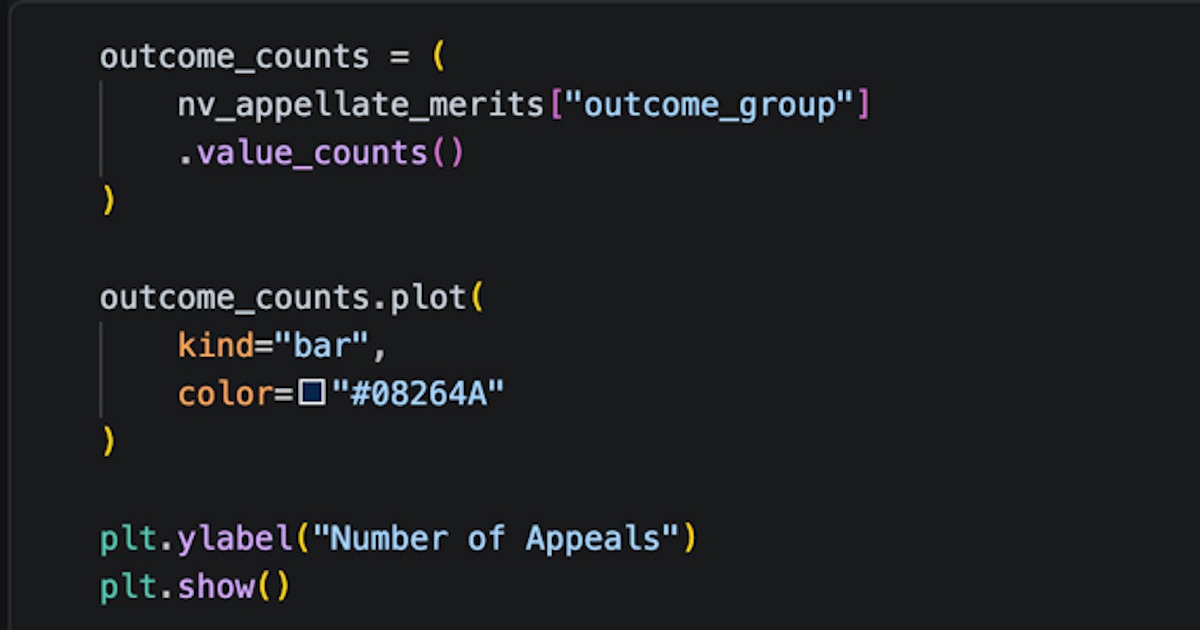
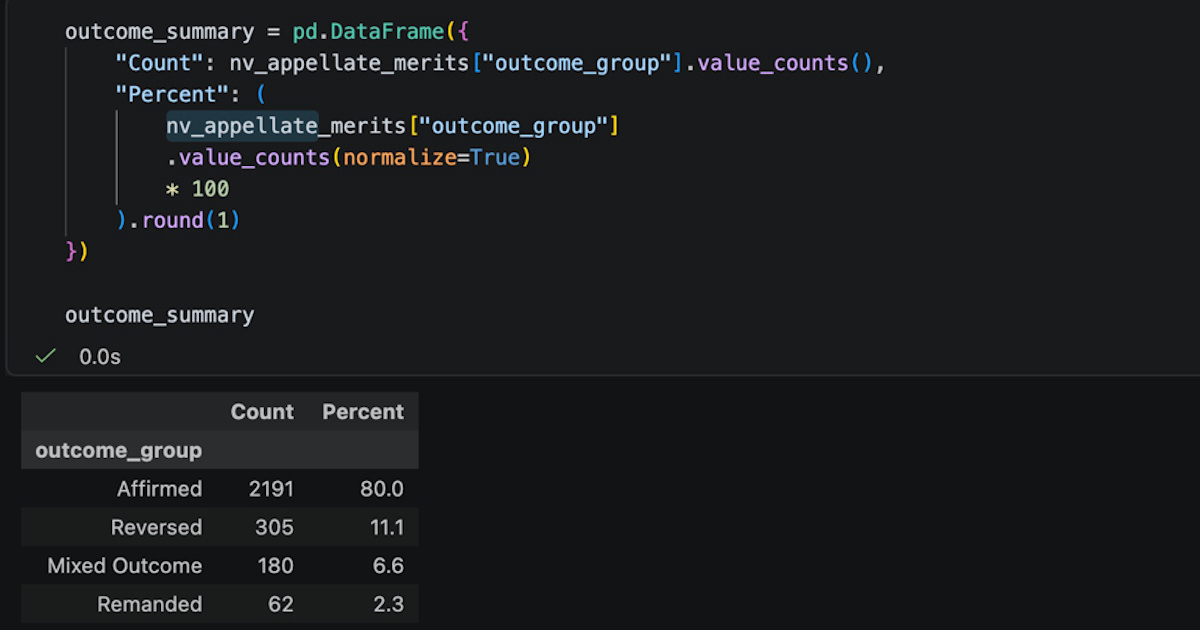
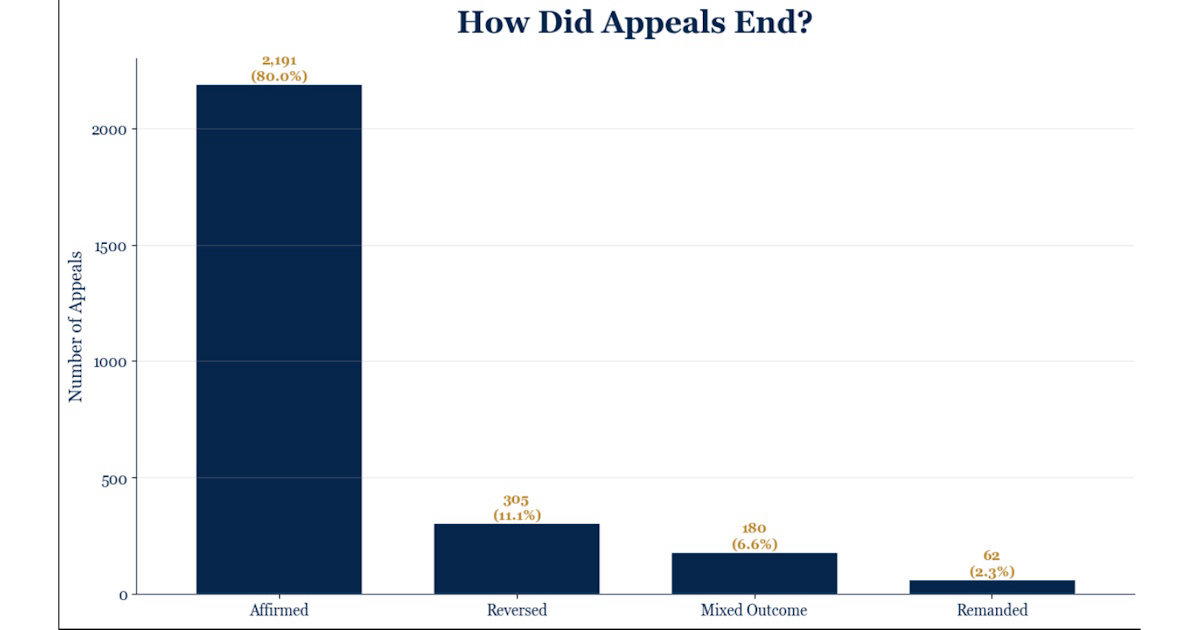
Case Outcome Histogram and Descriptive Statistics Eight out of every ten appeals in this dataset ended in an affirmance. In those cases, the appellate court left the lower court's decision unchanged. Reversed, mixed-outcome, and remanded appeals appeared much less frequently throughout the dataset. Given the nature of appellate review, this pattern is not unexpected.
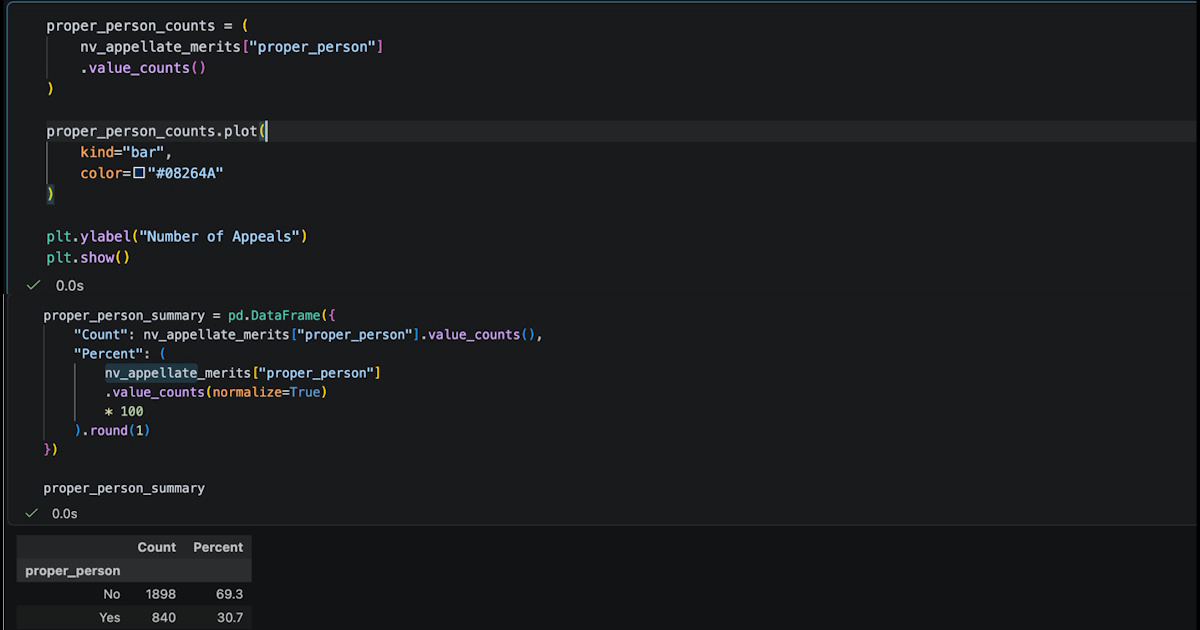
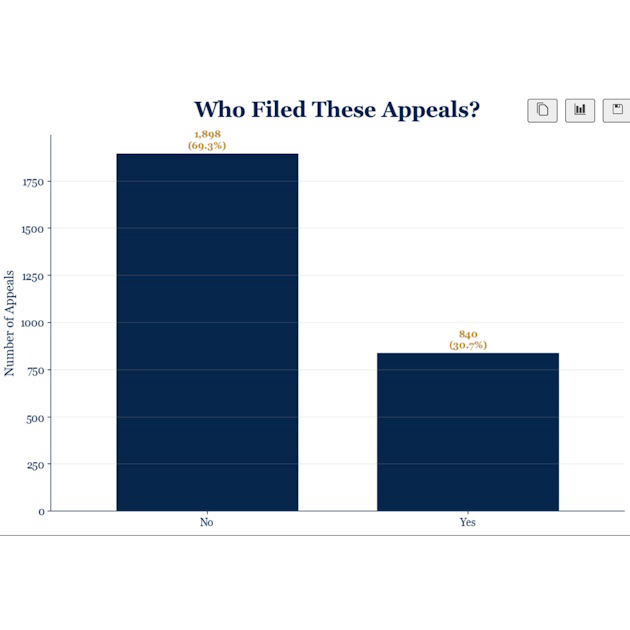
Proper Person Histogram and Descriptive Statistics Represented litigants accounted for 69.3% of merits appeals, compared with 30.7% for proper-person litigants. Around seven out of 10 merit appeals originate from represented parties.
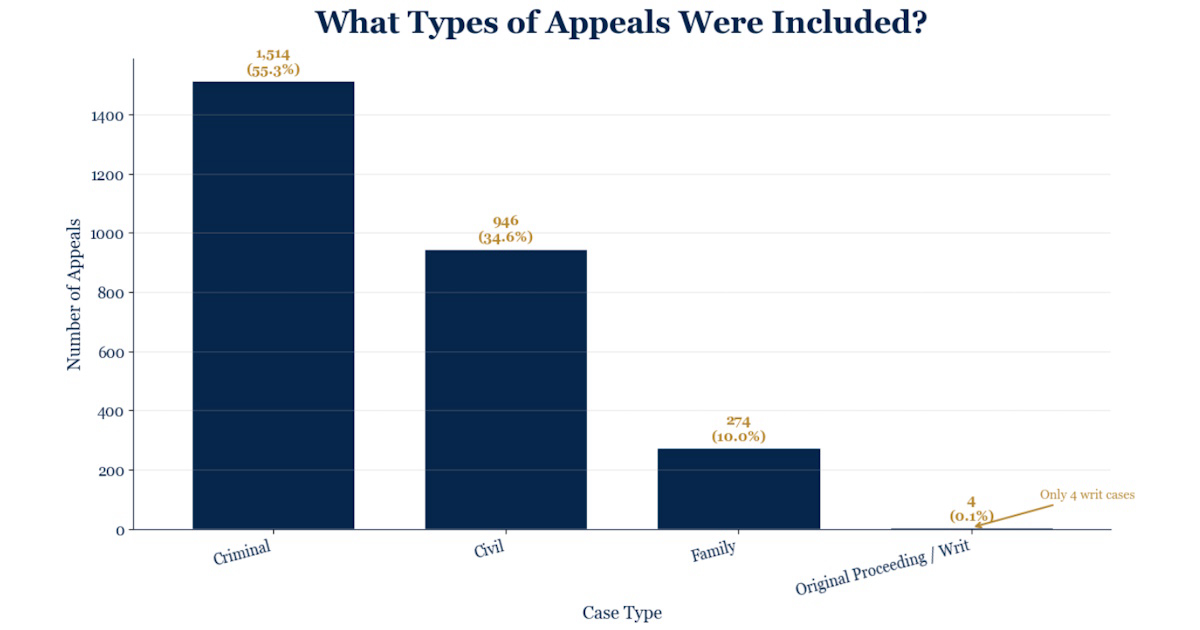
Case Types Histogram and Descriptive Statistics More than half of all merit appeals involved criminal cases, while civil and family appeals accounted for a much smaller share of the dataset. Despite being less common, civil appeals typically remained pending longer than criminal appeals. The evidence suggests that some types of appeals may take longer to process through the appellate system than others.
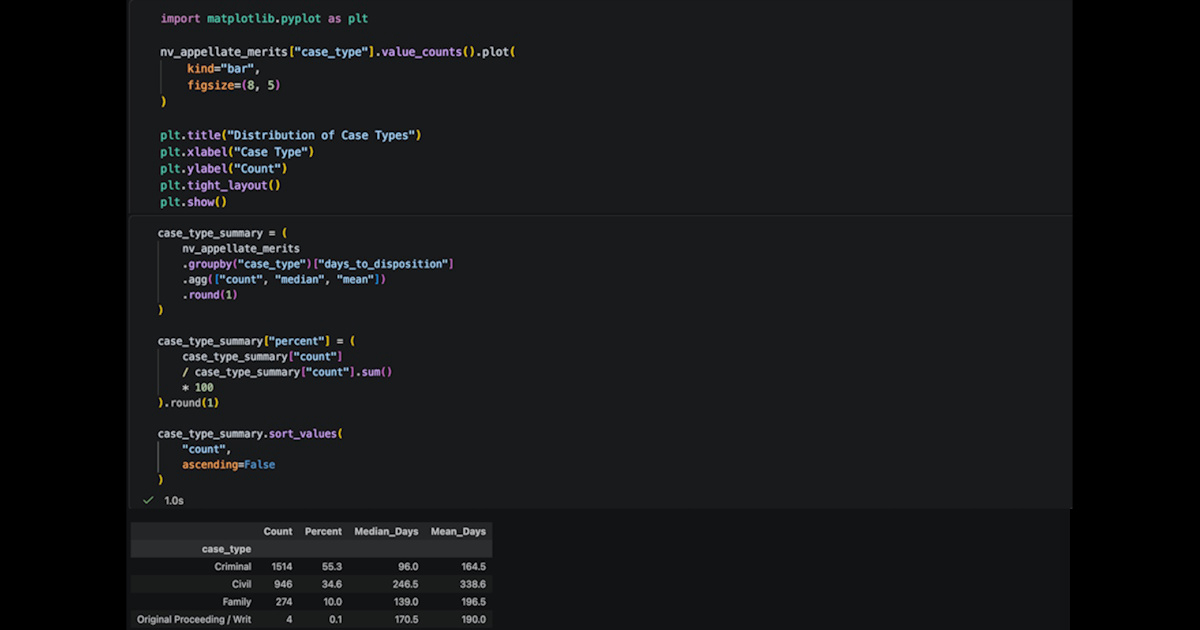
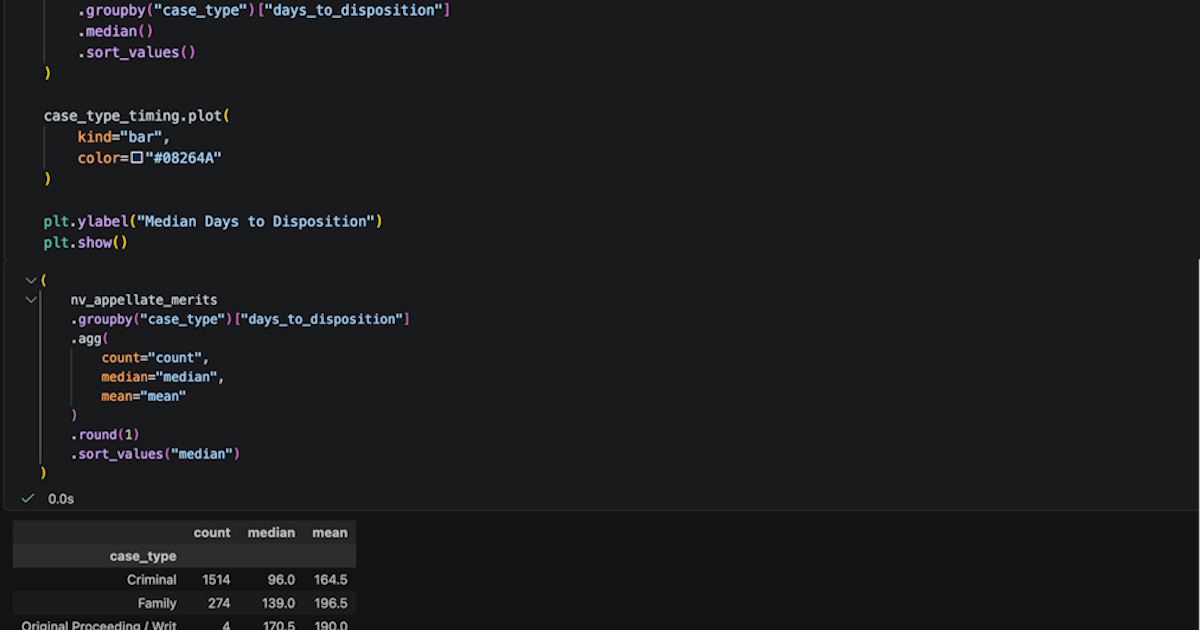
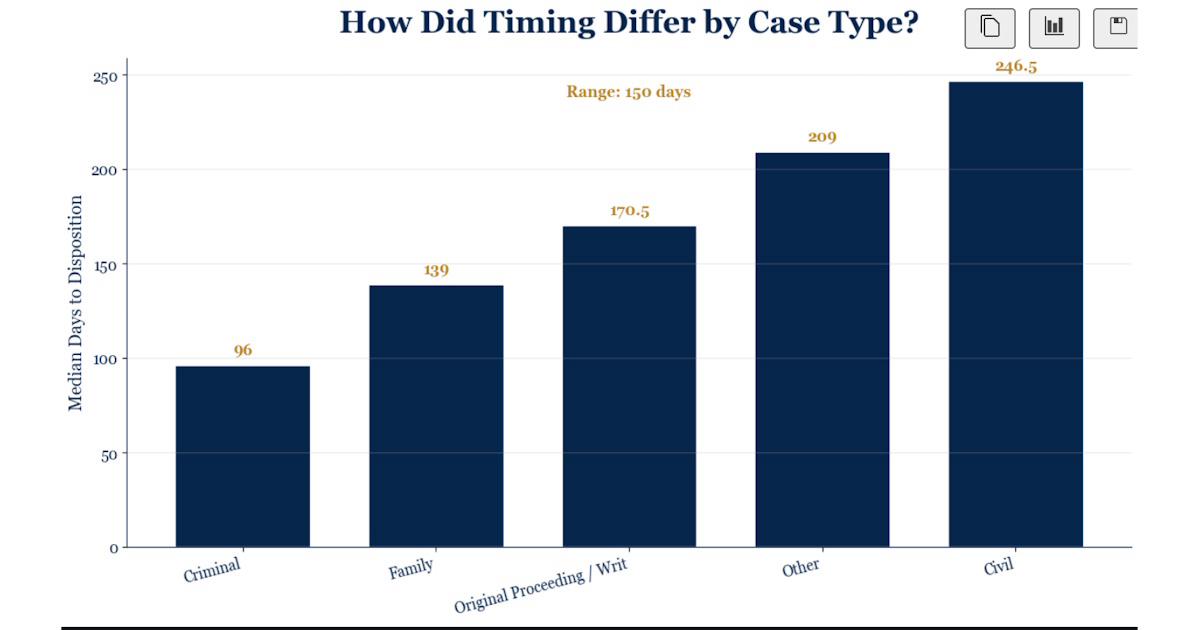
Disposition Timing by Case Type Histogram and Descriptive Statistics Civil appeals generally took longer to reach disposition than criminal and family appeals. Criminal cases had the shortest median disposition time (96 days), while civil cases had the longest (246.5 days).
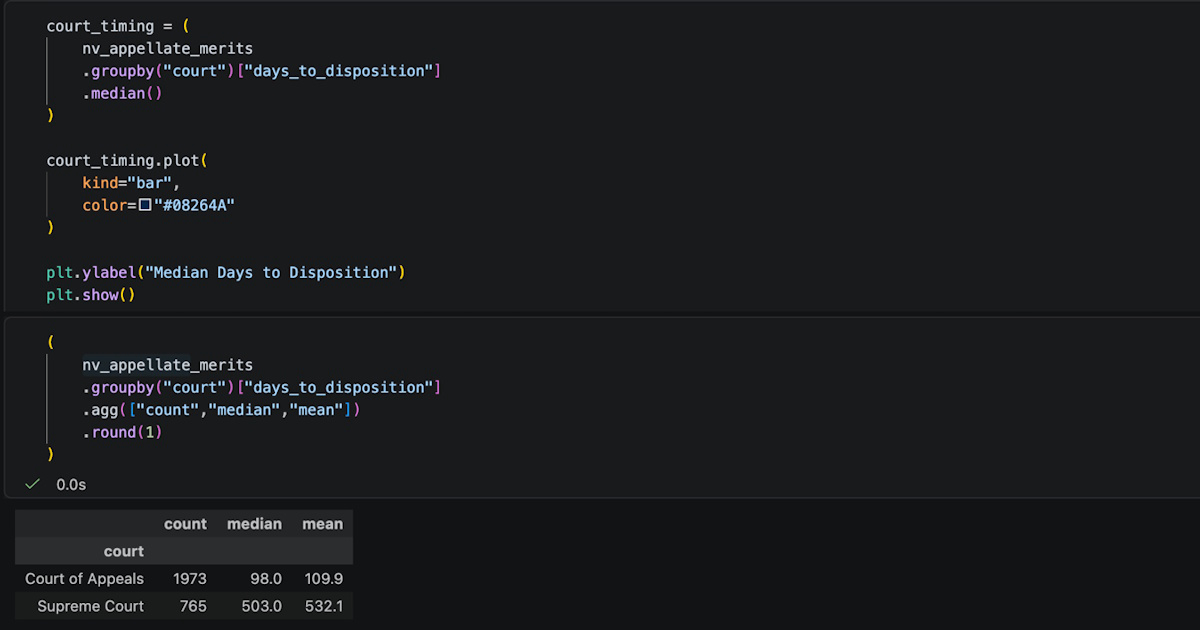
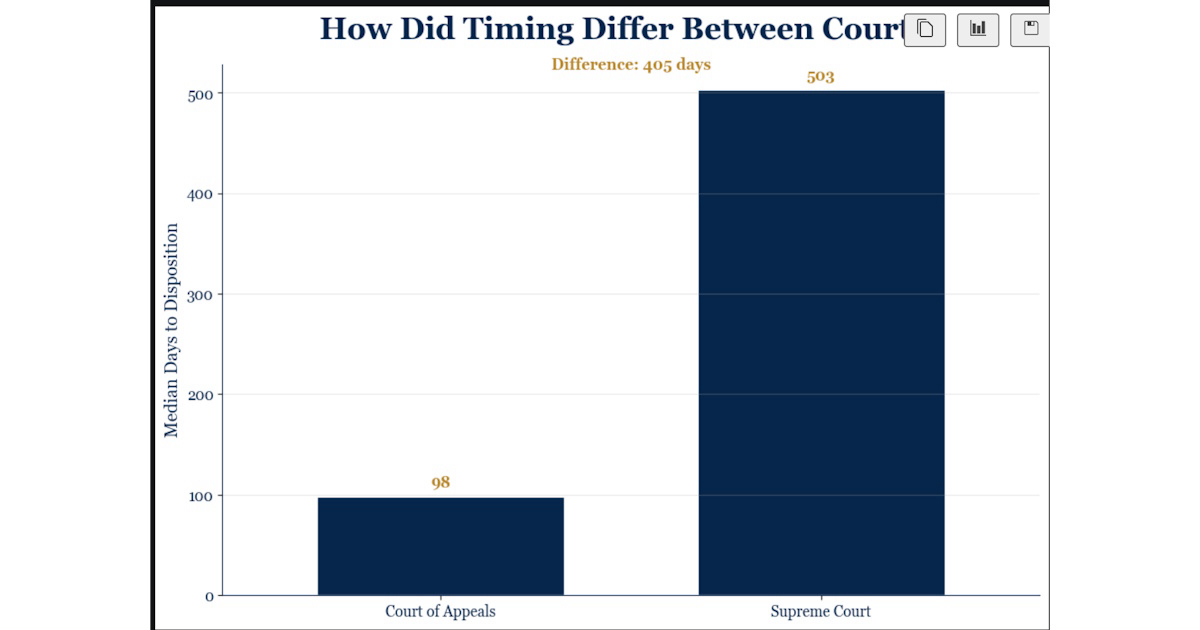
Disposition Timing by Court Histogram and Descriptive Statistics Appeals assigned to the Supreme Court generally took much longer to reach disposition than those assigned to the Court of Appeals. The median disposition time was 503 days for Supreme Court cases compared to 98 days for Court of Appeals cases.
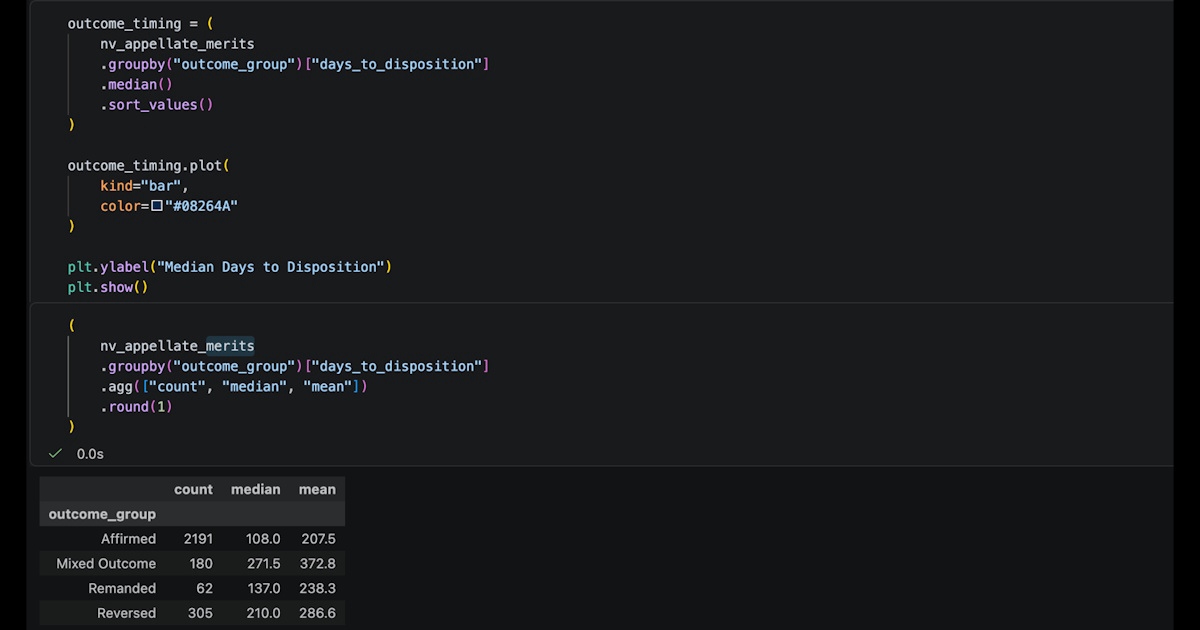
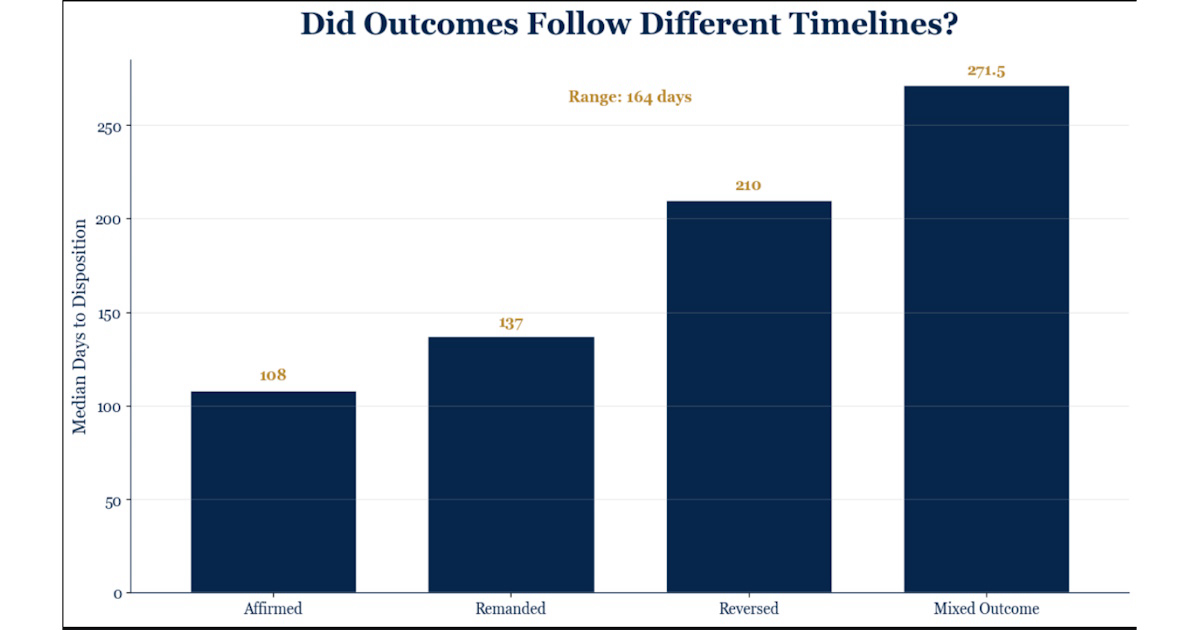
Disposition Timing by Outcome Group Histogram and Descriptive Statistics Outcome groups followed different disposition timelines. Appeals that ended in affirmance, where the appellate court left the lower court's decision unchanged (ABA, 2021), reached disposition more quickly than other outcome categories, with a median disposition time of 108 days. Appeals resulting in reversal or mixed outcomes generally remained pending longer. Mixed outcomes, which often involved a combination of dispositions such as affirmed in part and remanded, had the longest median disposition time at 271.5 days. Reversed appeals reached disposition in a median of 210 days.
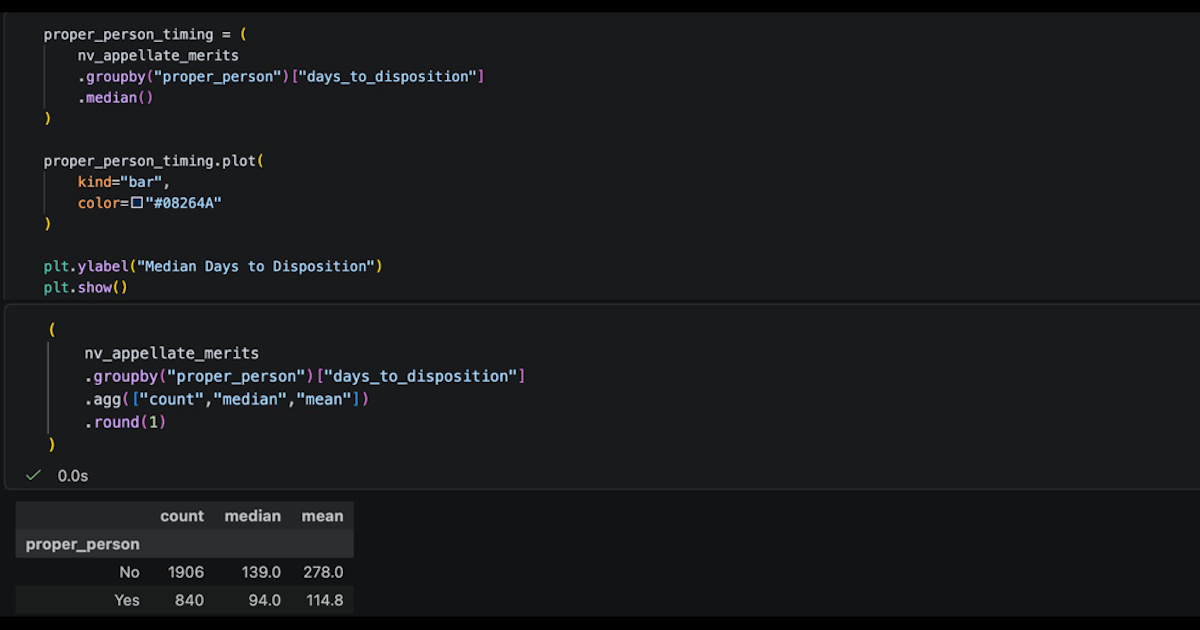
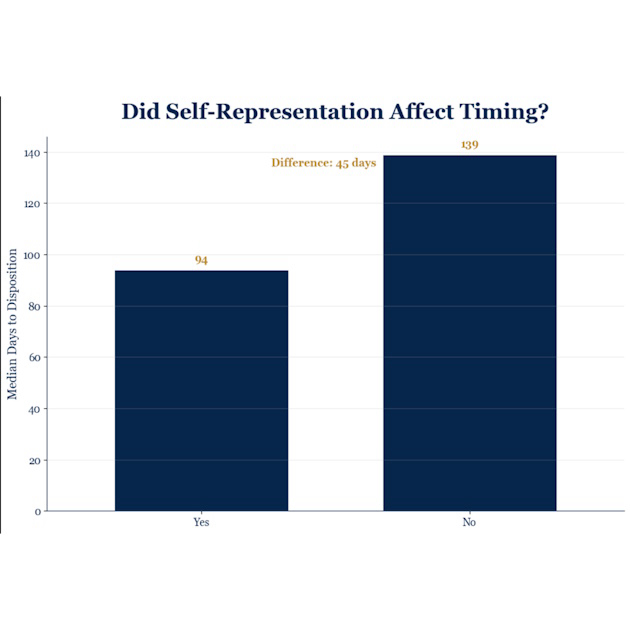
Disposition by Proper-Person Status Histogram and Descriptive Statistics Appeals involving self-represented (pro se) litigants tended to move through the appellate process more quickly than appeals involving represented parties. The median disposition time was 94 days for proper person appeals, compared with 139 days for represented appeals. However, this difference does not necessarily indicate that self-representation leads to faster dispositions. The appeals pursued by self-represented litigants may differ from those pursued by represented litigants in ways not measured in this study, including the complexity of the issues presented, the scope of the record, and other case-specific factors that could influence disposition timing.
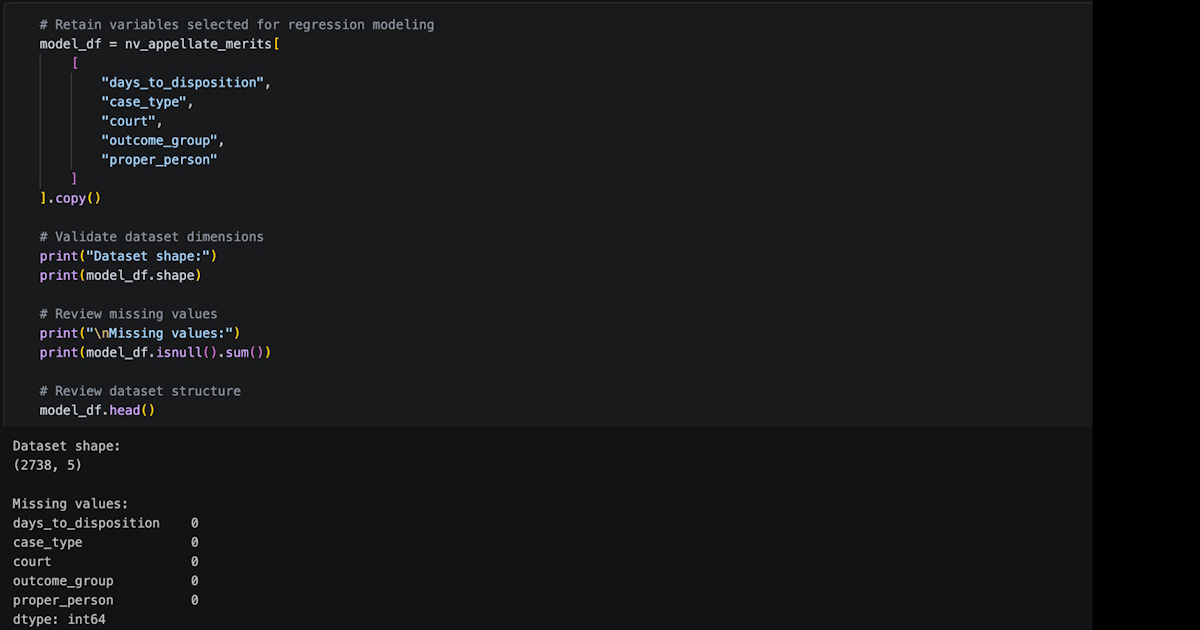
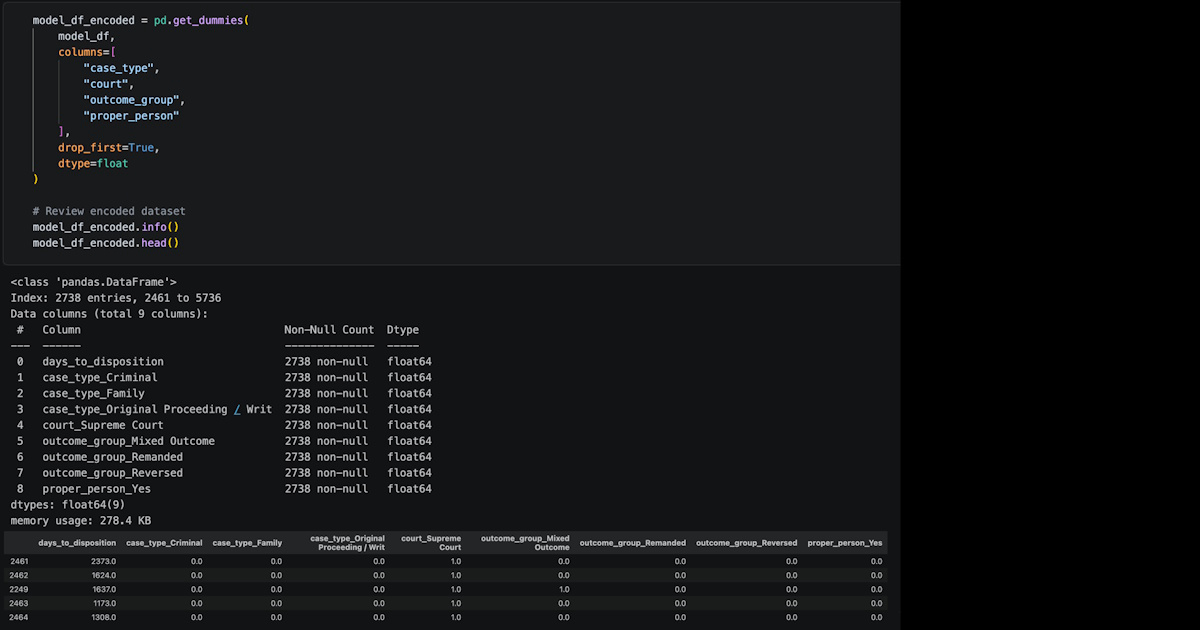
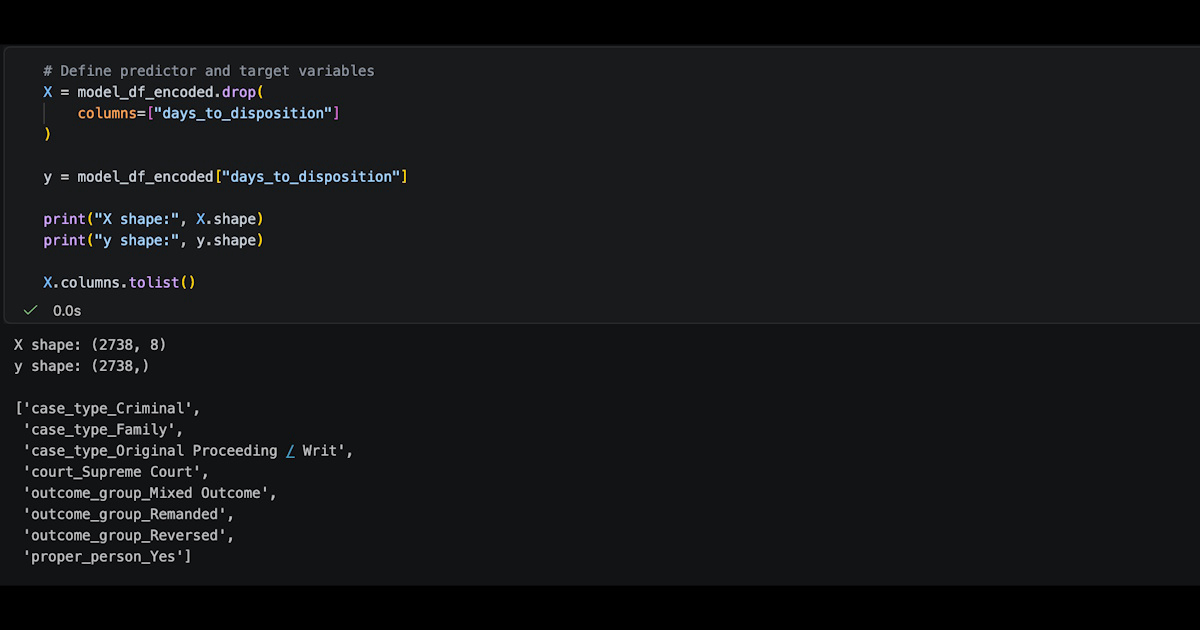
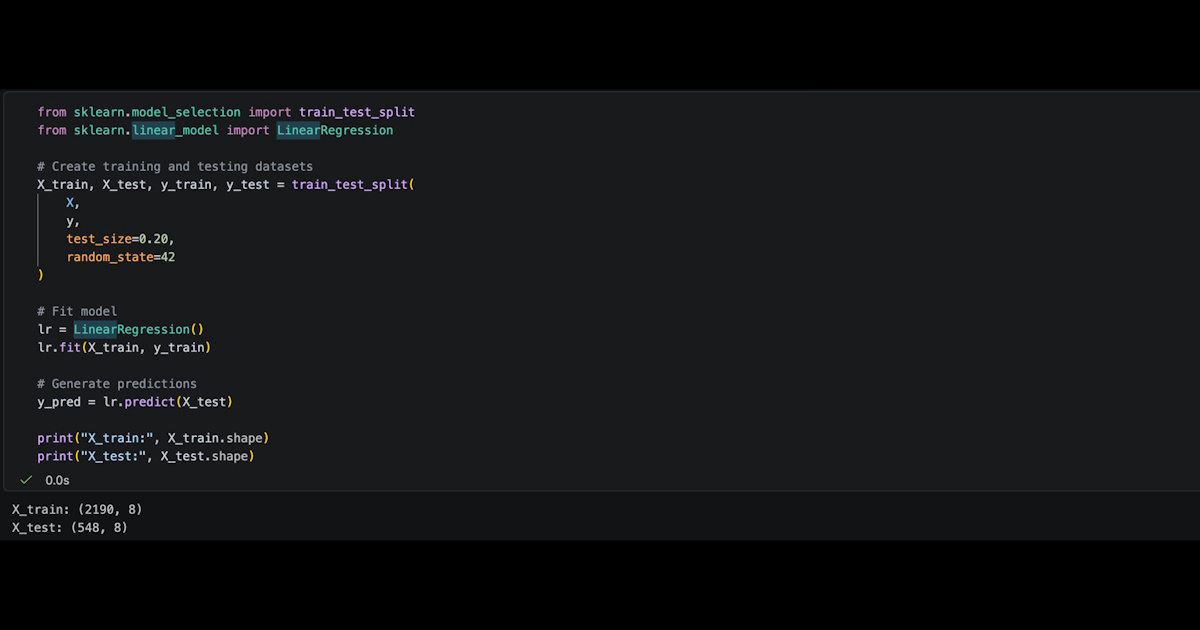
Train-Test Split and Linear Regression Model Training The workflow divided the dataset into 80% training and 20% testing subsets using a fixed random state of 42 (James et al., 2021). A multiple linear regression model was fitted using the training data and subsequently used to generate predictions on the testing dataset.
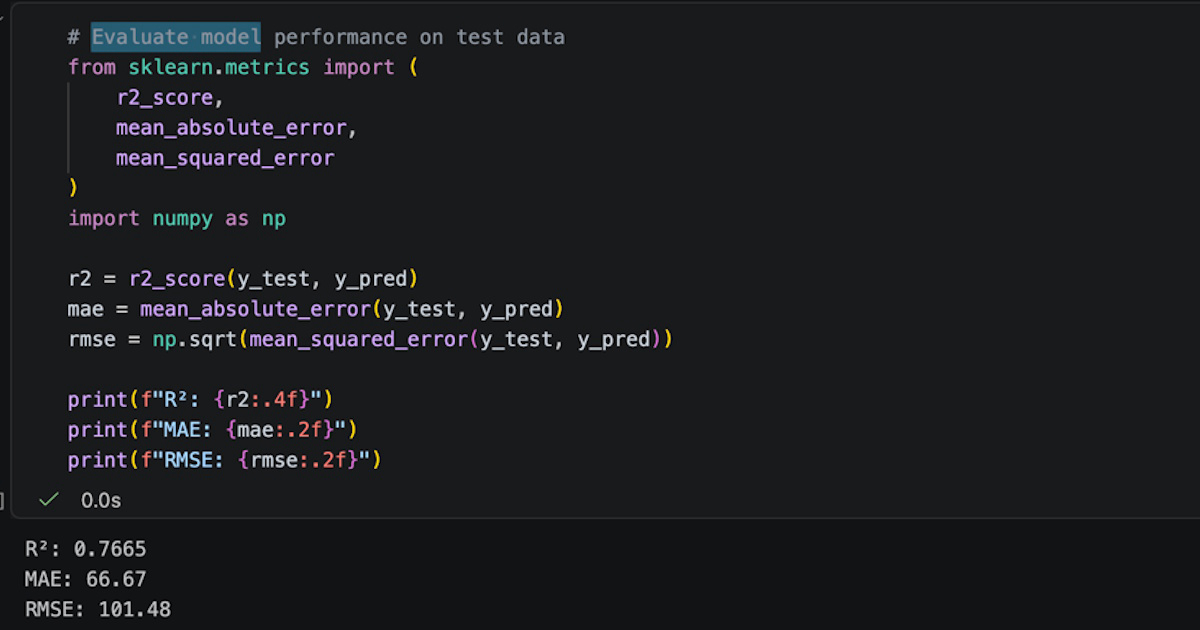
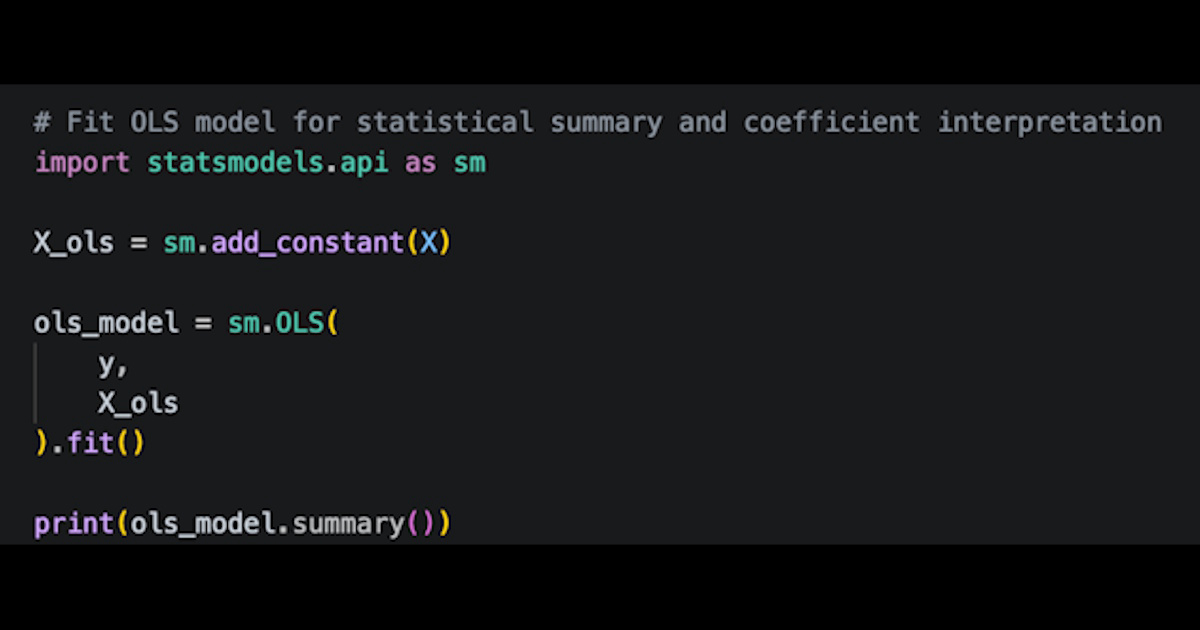
Evaluating Model Performance The model explained 76.7% of the variation in disposition timing (R² = 0.7665) when evaluated on the test set. The OLS regression produced similar results, explaining around 71% of the variation across appeals (Kutner et al., 2005). Prediction errors averaged 66.67 days, with an RMSE of 101.48 days. Court assignment had the strongest relationship with disposition timing, although case type, outcome group, and proper-person status also contributed to differences in appellate timelines. Taken together, the results suggest that a significant part of appellate delay can be linked to measurable characteristics contained within public appellate records.
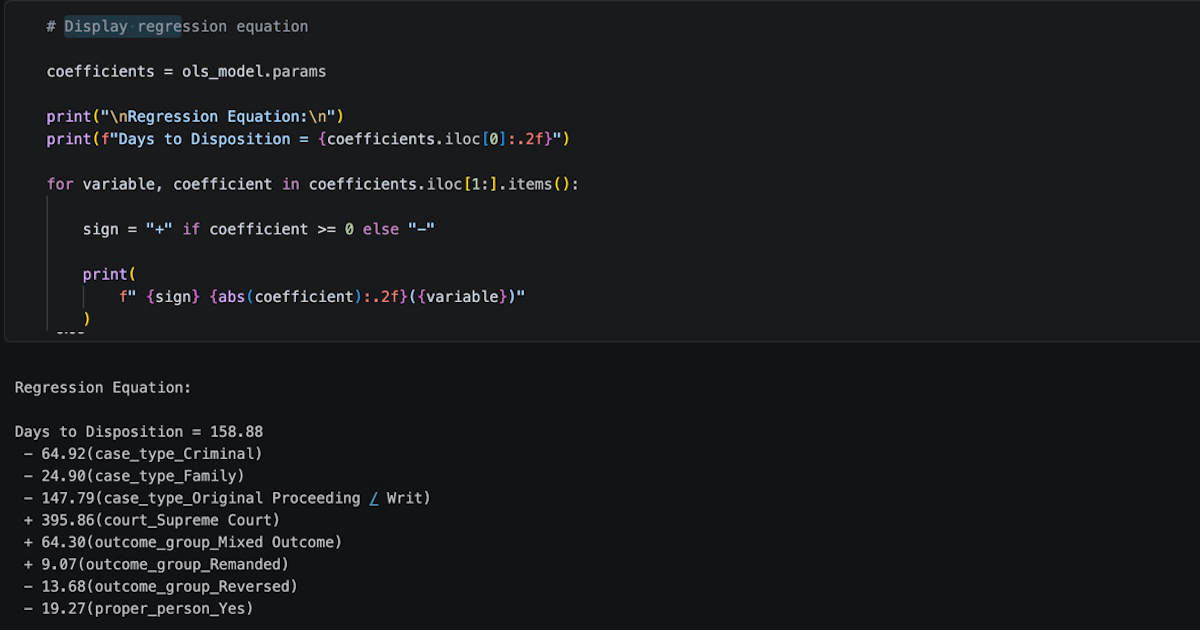
Interpretation of the Regression Equation
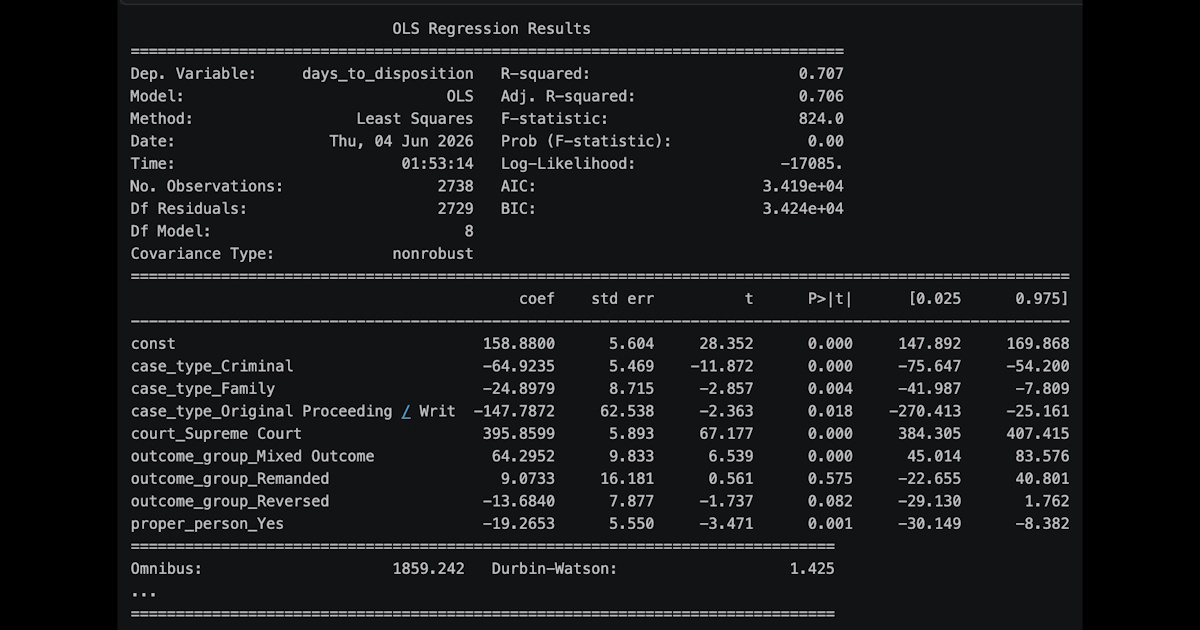
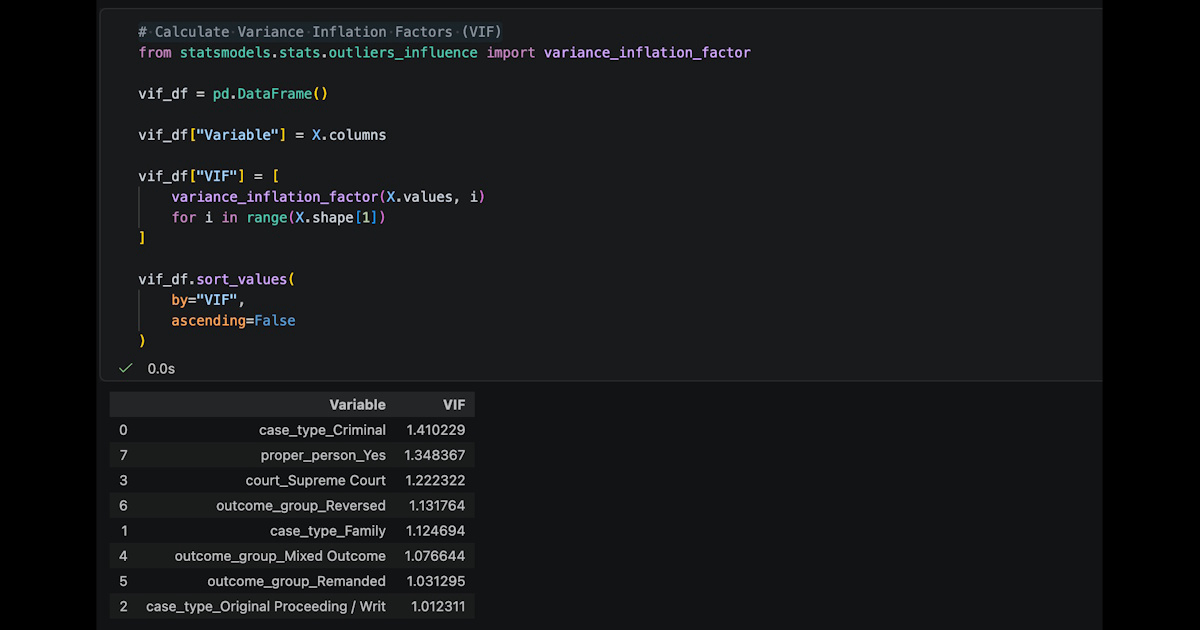
The overall regression model was statistically significant (F = 848.9, p < .001), indicating that the observed relationships were not due to chance. The results support rejection of the null hypothesis and indicate that appellate court assignment, case type, outcome group, proper-person status, or some combination of these characteristics influenced disposition timing (Kutner et al., 2005). Together, these measurable case characteristics explained a substantial portion of the variation in how long appeals remained pending.
Among all variables included in the model, court assignment showed the largest effect on disposition timing. Appeals assigned to the Nevada Supreme Court were associated with nearly 396 additional days to disposition compared with similar appeals decided by the Court of Appeals.
Differences in disposition timing also appeared across case types. Original proceedings and
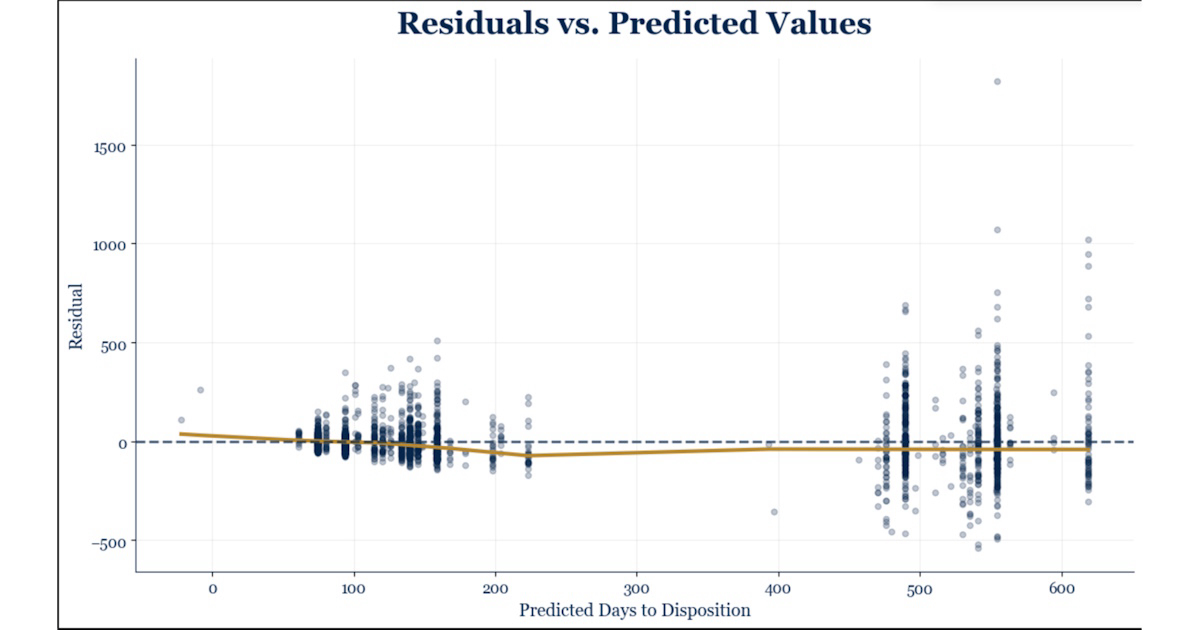
Residual vs Predicted Values Plot The residual plot showed that prediction errors remained fairly balanced around zero across the range of predicted values (Montgomery et al., 2021). Some increase in variability appeared among appeals with longer predicted disposition times, which was not surprising given the presence of unusually long-running cases in the dataset. Overall, the plot did not reveal a pattern suggesting that the model consistently overestimated or underestimated disposition timing. The residual plots reinforced a pattern seen throughout the analysis. Most appeals followed the timing patterns identified by the model, resulting in relatively small prediction errors (Kutner et al., 2005). Larger errors were concentrated among a small number of unusually long-running appeals.
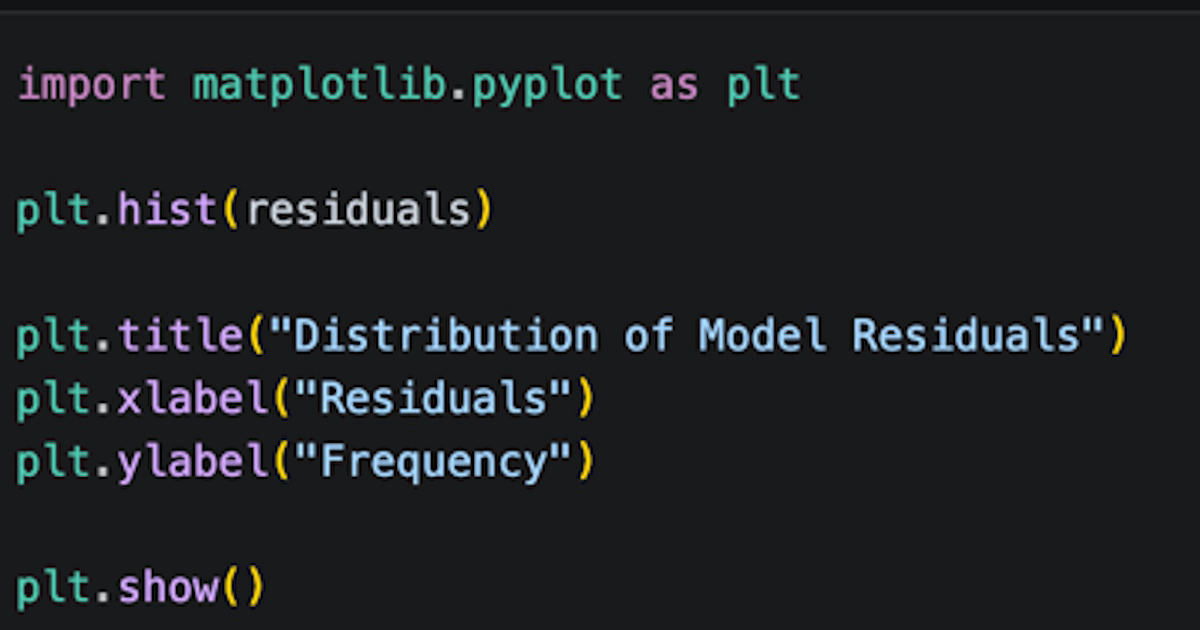
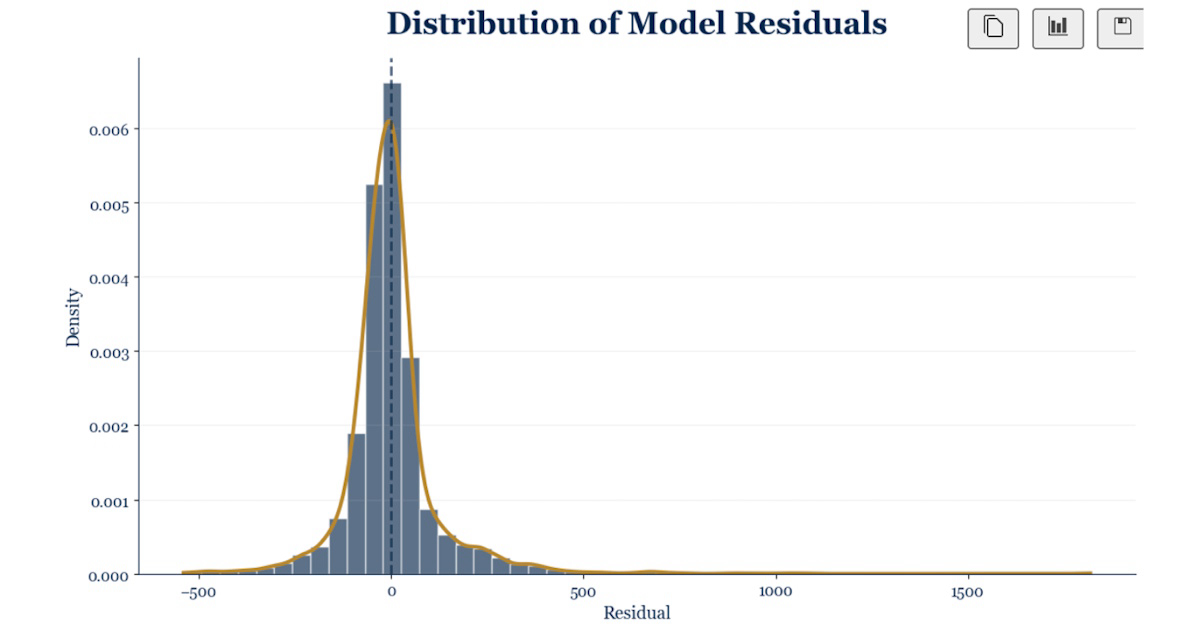
Residual Histogram The residuals clustered around zero, indicating that most appeals followed the model-identified timing patterns. Larger errors were concentrated among a small number of unusually long-running appeals. Because disposition times ranged from days to years, some skewness in the distribution was expected.
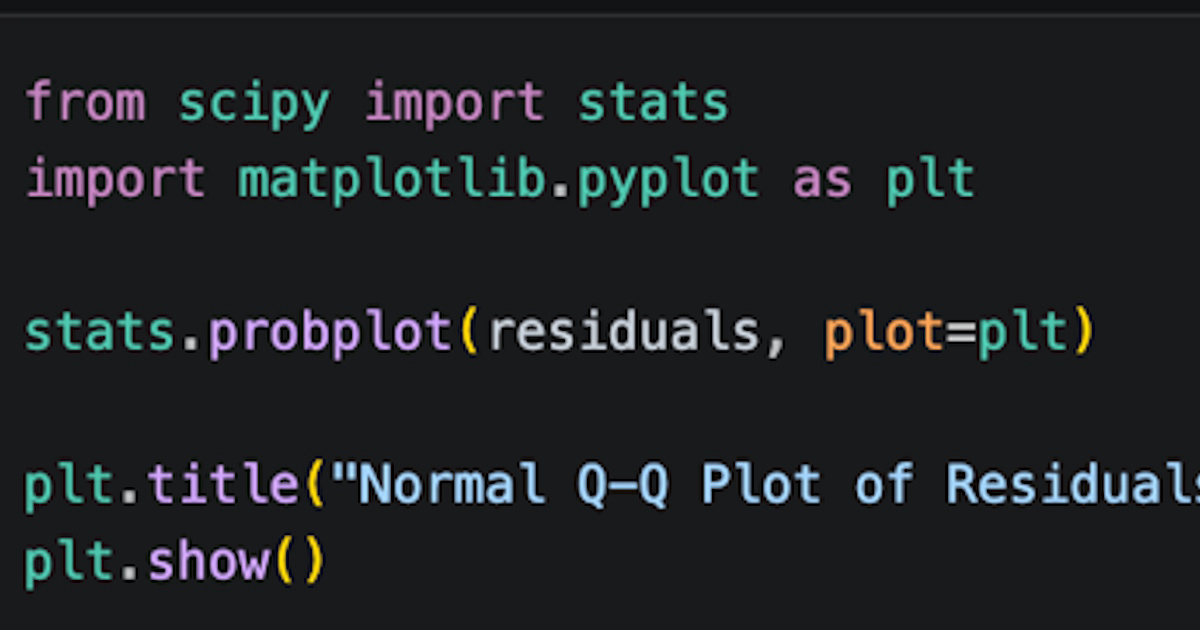
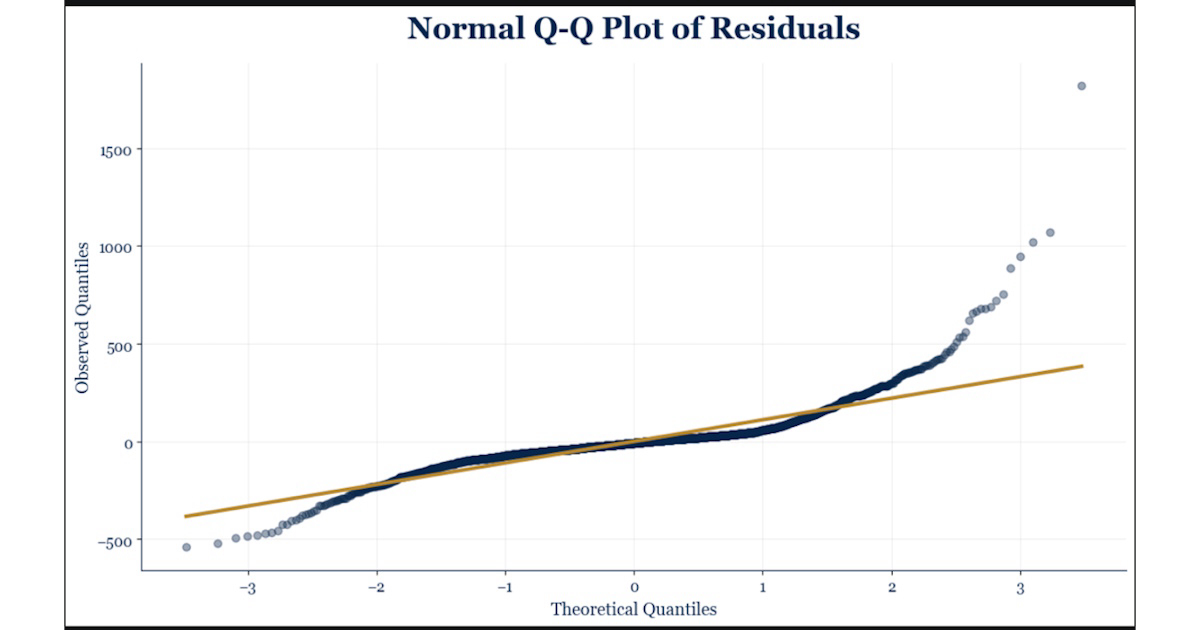
Assess Residual Normality Using Q-Q Plot Most residuals followed the expected normal pattern, with departures occurring primarily among a small number of unusually long-running appeals. Given the substantial variation in appellate disposition times, some deviation in the tails was expected. Overall, the Q-Q plot indicated that the residuals were reasonably consistent with the assumptions of multiple linear regression (Kutner, 2005).
The residuals clustered around zero, indicating that most appeals followed the model-identified timing patterns. Larger errors were concentrated among a small number of unusually long-running appeals. Because disposition times ranged from days to years, some skewness in the distribution was expected. The assumption diagnostic results suggest that the model captured the primary patterns in the data, even though some variability persisted in the most complex or time-consuming cases. One advantage of multiple linear regression is its interpretability. The model predicts disposition timing and helps identify which case characteristics are most strongly associated with longer or shorter appellate timelines. A limitation is that the model can evaluate only the information available in the dataset. Factors such as case complexity, judicial workload, briefing demands, and the legal issues presented on appeal likely influence appellate timing, but these factors were not available in the public records used for this study. Findings One of the most interesting findings was the analysis showed that a relatively small number of observable case characteristics explained much of the variation in appellate disposition timing. Court assignment, case type, outcome group, and proper-person status showed meaningful relationships with disposition timing. Together, these variables explained approximately 71–73% of the differences seen across appeals. The model's explanatory power demonstrates that disposition timing follows a recognizable pattern. While every appeal has its own facts and legal issues, much of the variation in disposition timing can be linked to characteristics available in public appellate records. The fact that these variables explained more than 70% of the observed variation suggests that appellate case processing follows sufficiently stable patterns. However, the dataset did not capture all the nuanced factors that could influence the timing of appellate dispositions. Variables outside the collected data may explain some of the variation that remained outside the model's explanatory power (Kutner et al., 2005). Court assignment explained more variation in appellate disposition timing than any other variable included in the model. Appeals assigned to the Nevada Supreme Court generally required substantially more time to reach disposition than appeals assigned to the Court of Appeals, even after controlling for other case characteristics. Meaningful differences were also seen across case types and outcome groups. Criminal appeals generally reached disposition more quickly than civil appeals, while mixed-outcome cases tended to require longer periods of review. Proper-person status was also associated with differences in the timing of disposition. These results suggest that observable characteristics of an appeal help explain differences in disposition timing. Although the model explained a substantial portion of the variation in appellate disposition timing, some differences among appeals remained unexplained (James et al., 2021). The analysis relied entirely on information available in public appellate records, which limited the variables available for study. Important factors such as issue complexity, record size, briefing demands, oral argument activity, number of parties, and overall judicial workload were not captured in the dataset. As a result, the model could identify broad timing patterns throughout appellate cases but could not account for every factor that may influence how long a particular appeal remains pending. One of the most important observations from this study is that broad case labels do not always reflect the actual complexity of an appeal. Two cases classified within the same category may involve very different legal questions, workloads, and procedural histories. These differences likely account for some of the unexplained variation observed in the model. Practical Applications Researchers and court administrators have studied case-processing times for decades because the length of time required to resolve cases reflects an important aspect of court operations (Steelman et al., 2004). For litigants, appellate delay affects how long they must wait for a final resolution. For courts, disposition timing provides a way to examine case flow patterns and identify factors associated with longer processing times. A practical takeaway from the study is that appellate timing appears far more predictable than many litigants might assume. The analysis showed that much of the variation in disposition timing could be linked to a relatively small number of observable case characteristics. These findings improve understanding of how appeals move through the system and help identify cases at risk of taking longer than expected. At the same time, the remaining unexplained variation suggests opportunities to collect more detailed information about the issues raised on appeal. Court personnel already review those issues during case screening and routing. Capturing that information in a structured format could help explain additional variation in disposition timing while creating a richer dataset for future analysis, workload forecasting, and appellate analytics (Kuhn & Johnson, 2019). Future Research While appeals that share the same label (civil, criminal, family) provide a general category, each case still involves nuanced legal issues, procedural histories, and workload demands. Future research could explore whether collecting more details and issue-level information helps explain some of the timing differences observed across appeals and improves the ability to predict how long a case will remain pending. Capturing more granular information may improve future analyses by providing variables that better distinguish among appeals with different characteristics (Kuhn & Johnson, 2019). The current model relied on information available in public appellate records. Important aspects of appellate workload, such as oral argument activity, briefing volume, record size, the number of parties, and procedural motions, were unavailable for analysis. Examining these factors may help explain some of the remaining variation in disposition timing in the present study. A key direction for future research is to capture issue-level information from appellate cases. Appeals grouped within the same broad case category frequently involve very different legal questions and may require substantially different levels of judicial review. Issue-specific data could help explain why some appeals move through the system more quickly than others and may improve the accuracy of future models. The remaining unexplained variation also points to factors that were not available in the current dataset. Oral argument activity, briefing demands, record size, number of parties, and procedural motions may all influence appellate timing. Examining these factors could provide additional insight into the differences seen across appeals and help explain the remaining variation outside the model. Capturing more detailed, issue-level case information during screening and routing may help explain differences in disposition timing that remain unaccounted for in the current model and could support future workload forecasting efforts. References American Bar Association. (2021, November 28). How courts work: Appeals. Bureau of Justice Statistics. (2006). State court caseload statistics, 2004 (NCJ 212979). U.S. Department of Justice, Office of Justice Programs. https://bjs.ojp.gov/content/pub/pdf/casc.pdf Clark County Bar Association. (2025, February 17). The Nevada Court of Appeals completes its first decade. https://clarkcountybar.org/the-nevada-court-of-appeals-completes-its-first-decade/ James, G., Witten, D., Hastie, T., & Tibshirani, R. (2021). An introduction to statistical learning (2nd ed.). Springer. Kuhn, M., & Johnson, K. (2019). Feature engineering and selection: A practical approach for predictive models. CRC Press. Kutner, M. H., Nachtsheim, C. J., Neter, J., & Li, W. (2005). Applied linear statistical models (5th ed.). McGraw-Hill Irwin. Montgomery, D. C., Peck, E. A., & Vining, G. G. (2021). Introduction to linear regression analysis (6th ed.). Wiley. Nevada Judiciary. (n.d.-a). How cases make it through Nevada's appellate courts. Nevada Judiciary. Nevada Judiciary. (2026). Outreach and Engagement Plan. Strategic Action Campaign 2026-2028. Nevada Judiciary. (n.d.-b). Public case search: Nevada appellate case management system. Nevada Rules of Appellate Procedure. (n.d.). Nevada Legislature. Selenium Project. (n.d.). Selenium. https://www.selenium.dev/ Steelman, D. C., Goerdt, J. A., & McMillan, J. E. (2004). Caseflow management: The heart of court management in the new millennium. National Center for State Courts.

Ronchi: The Pace of Appellate Justice, Perspectives, 11 minutes, 45 seconds
Analyst Joanna Ronchi covers predictive analytics for timing in our appellate courts, including factors associated with disposition timing. You can read her report here: https://ournevadajudges.com/media/coverage/117-factors-associated-with-disposition-timing-in-appellate-court You can join as a member by clicking this link here: https://www.youtube.com/channel/UCJPb0hCUcufpuk7QhxVxwKA/join For inquiries, feel free to contact us through www.ournevadajudges.com



©2026 Our Nevada Judges, Inc.
Terms & ConditionsVersion: 5.2.8Privacy Policy
An NRS Chapter 82 non-profit corporation. Recognized by the IRS as a Section 501(c)(3) organization.