Why Civil and Criminal Cases Should Be Reported Separately
Policy proposal for the bifurcation of criminal and civil error rates.
A report by Joanna Ronchi, Analyst.
Interpretation Of Judicial Error Rate By Sample Size In Criminal Cases
Joanna Ronchi, Data Analyst;
Nov 20, 2025, 9:00 AM
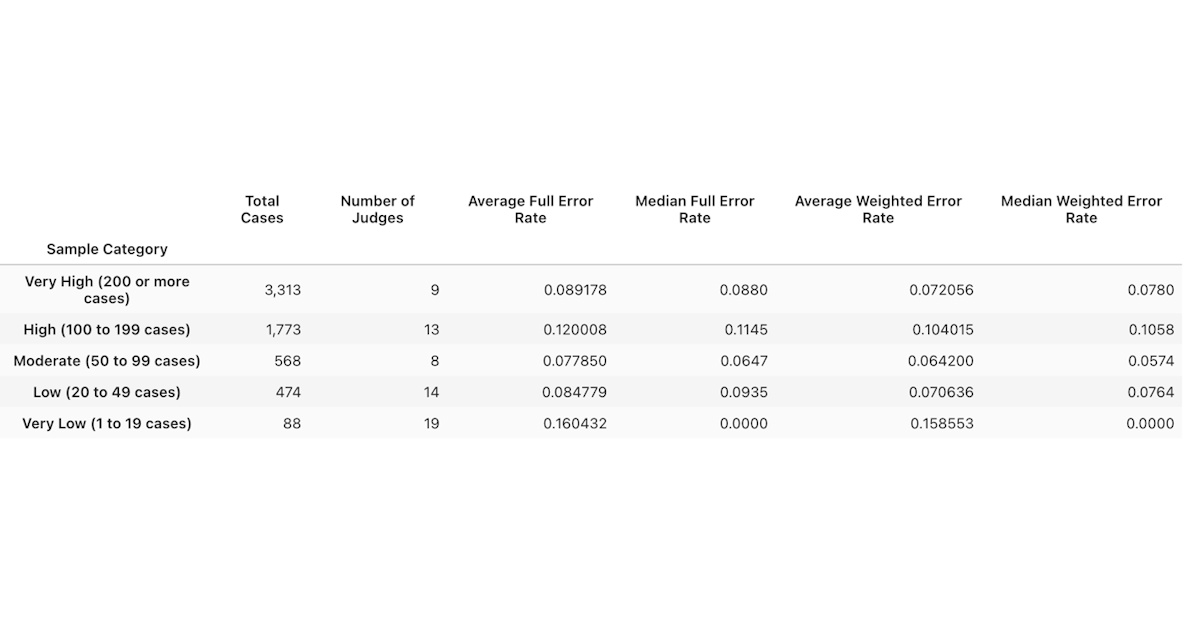
Summary of Justification for Sample Size Grouping To ensure that judicial error rates are interpreted fairly and accurately, judges were grouped into five categories based on their total number of criminal appellate cases. Error rates derived from very small samples can fluctuate dramatically, sometimes by several percentage points with only one additional case, which makes them statistically unreliable. As the number of cases increases, the error rate becomes much more stable and reflective of a judge’s true performance.
While the court appreciates efforts to bring greater transparency to the court system, we cannot corroborate the data nor verify the source of information, so the court is not in a position to comment on the veracity of the statistics cited in your article.
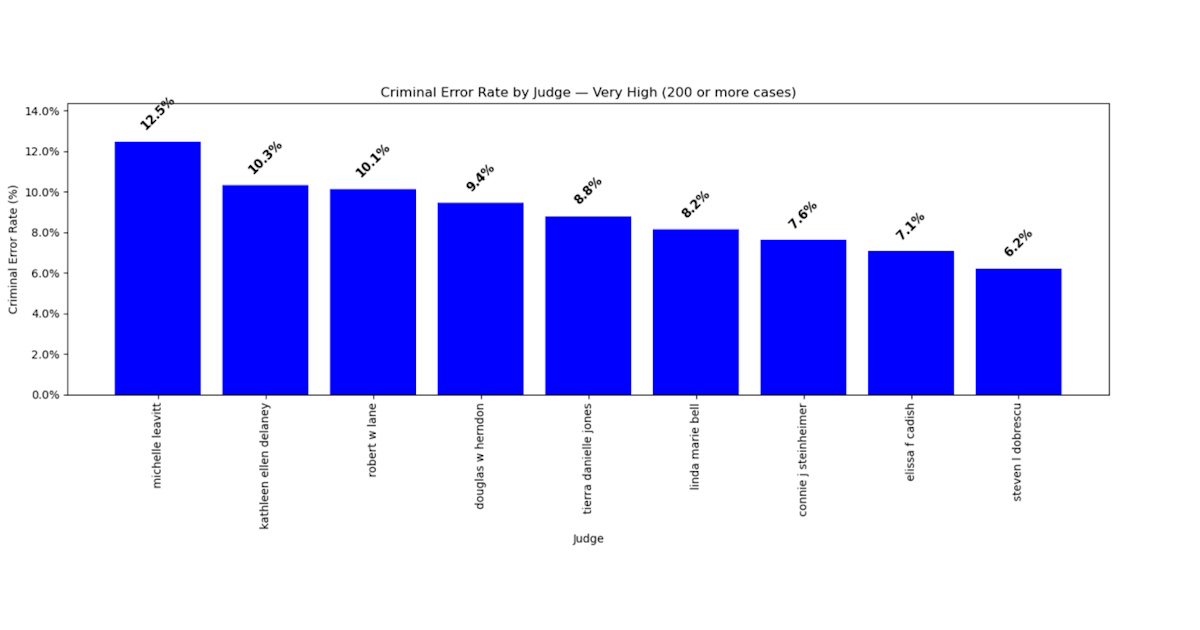
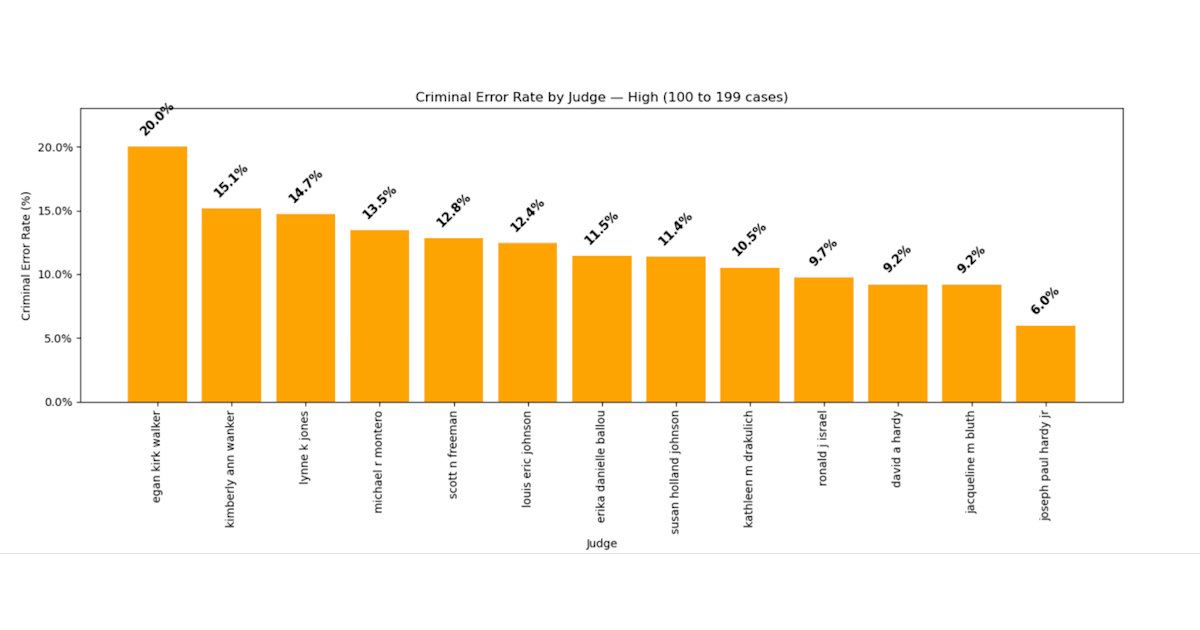
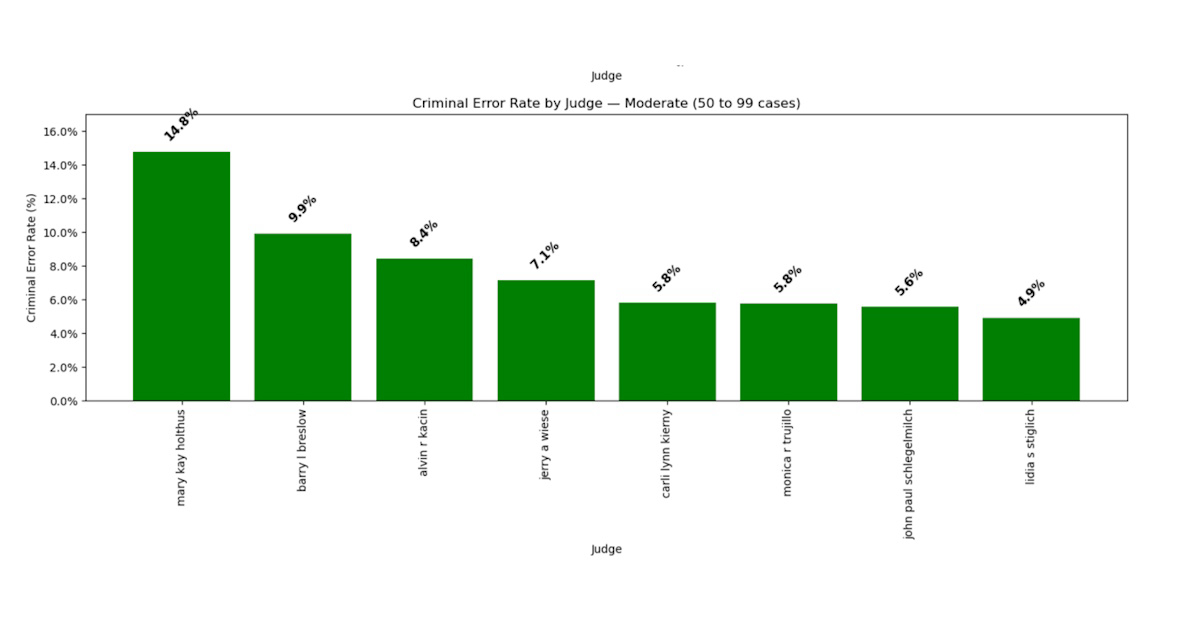
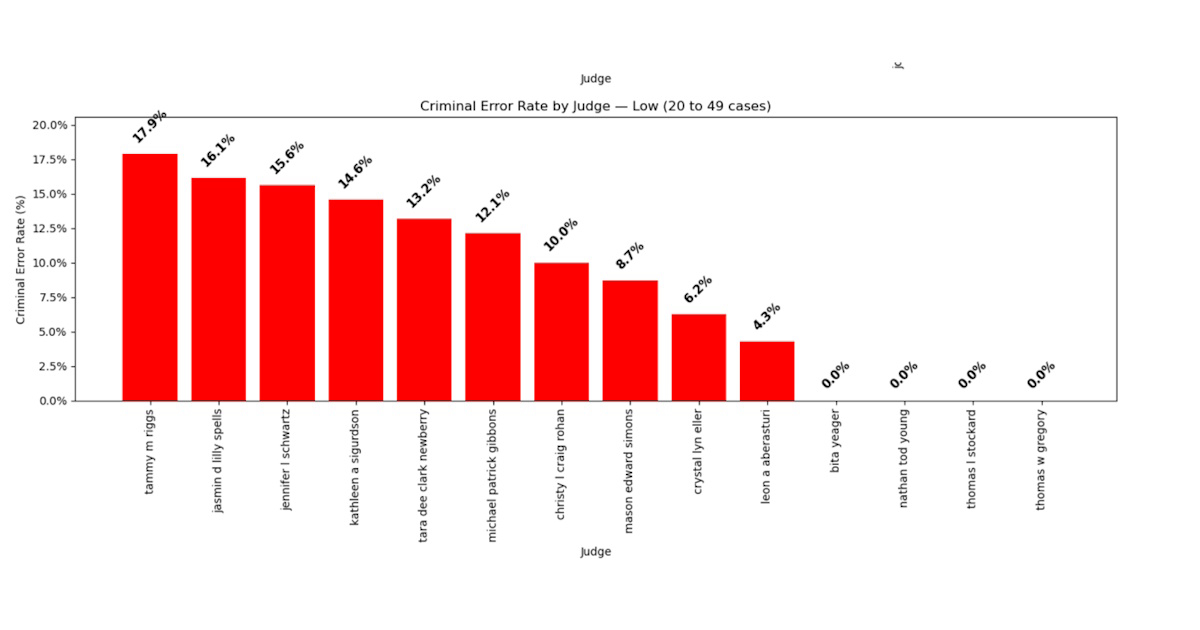
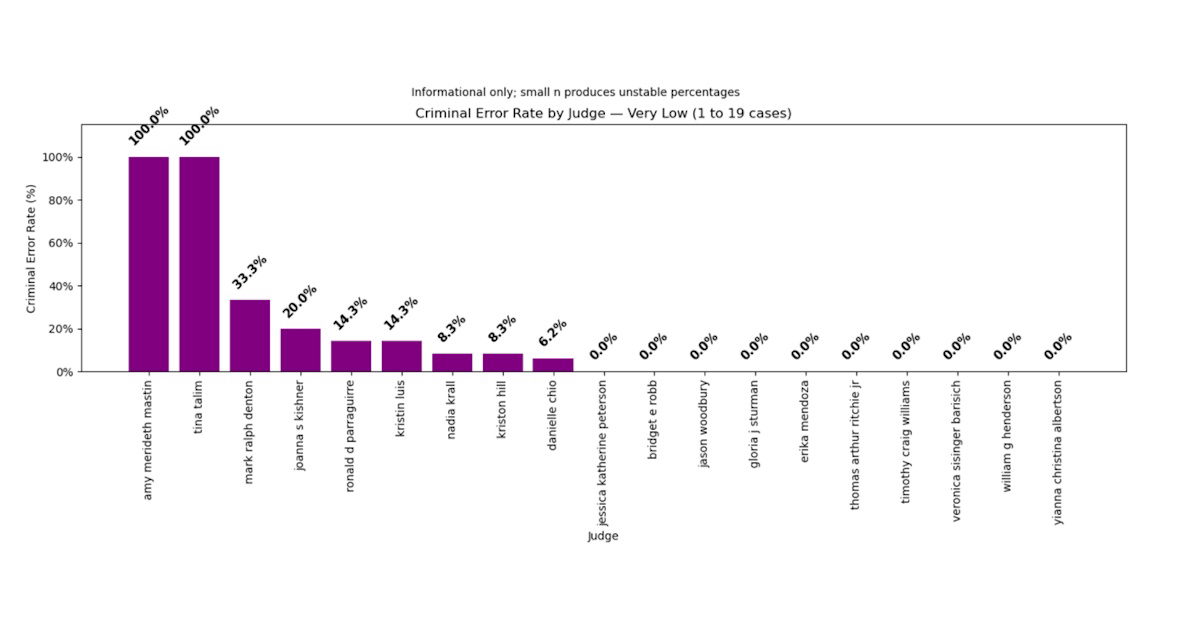
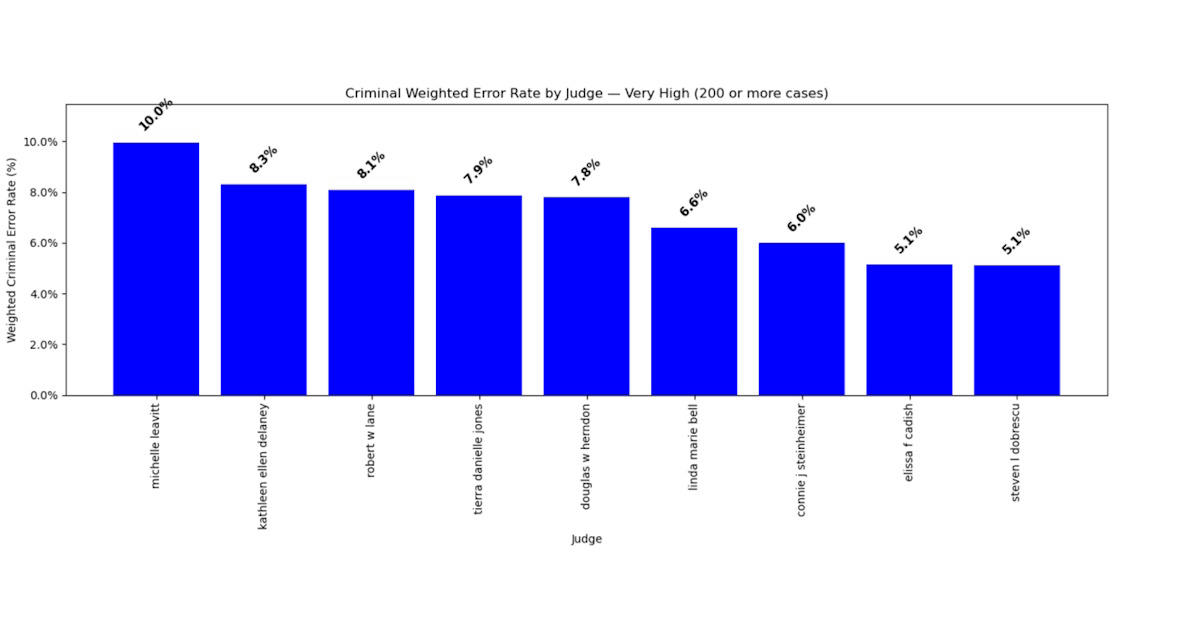
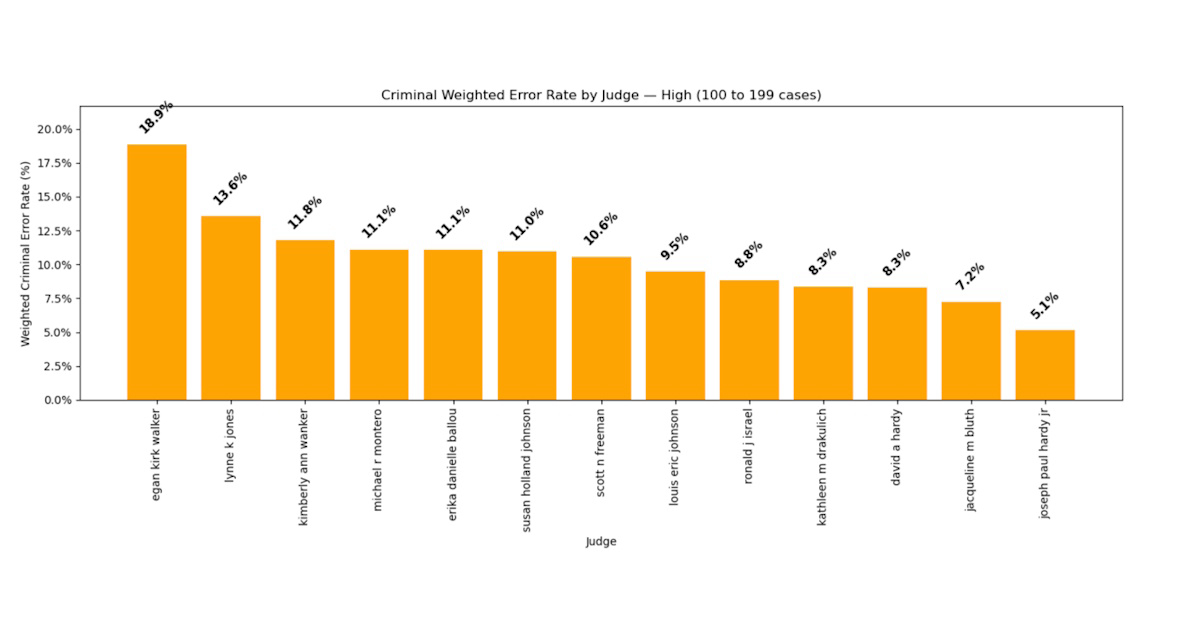
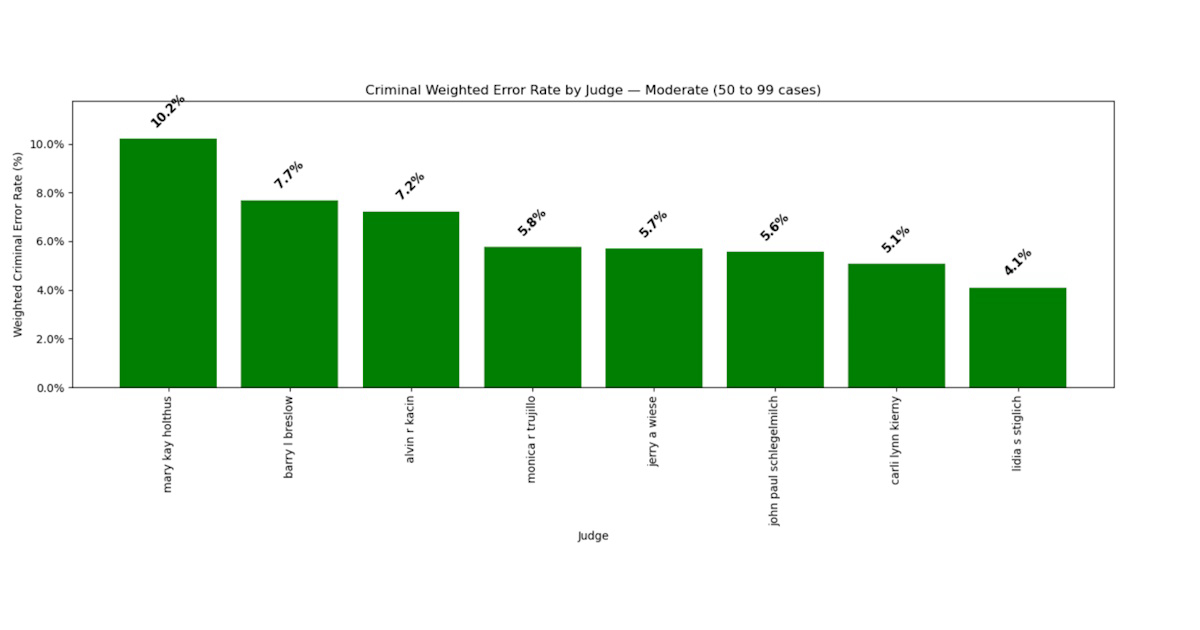
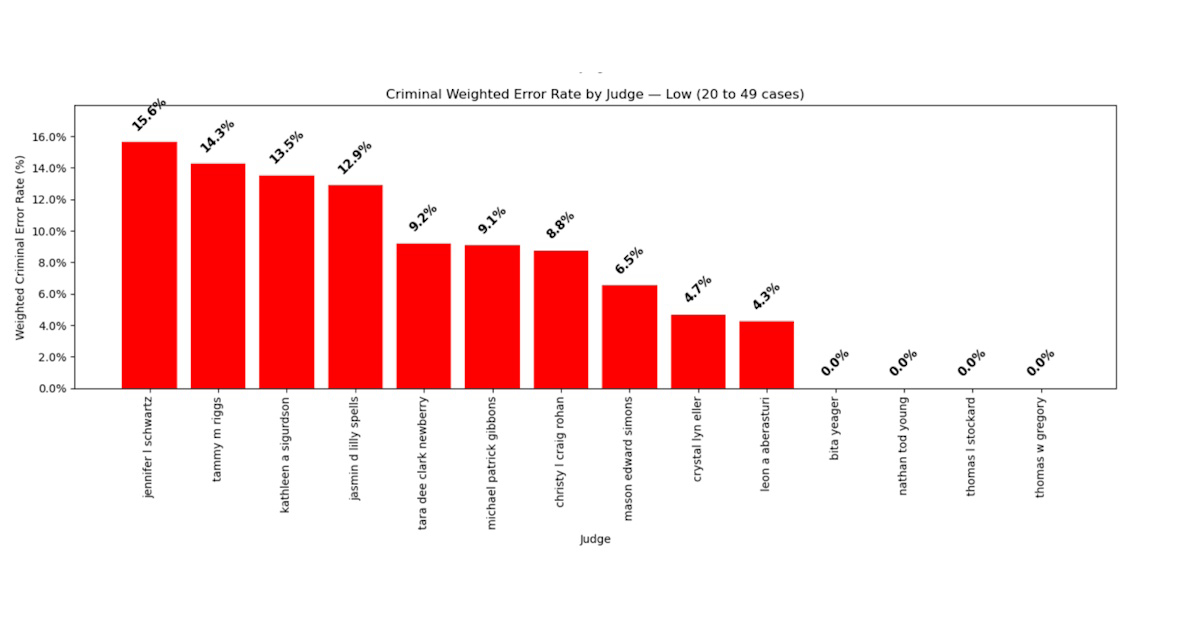
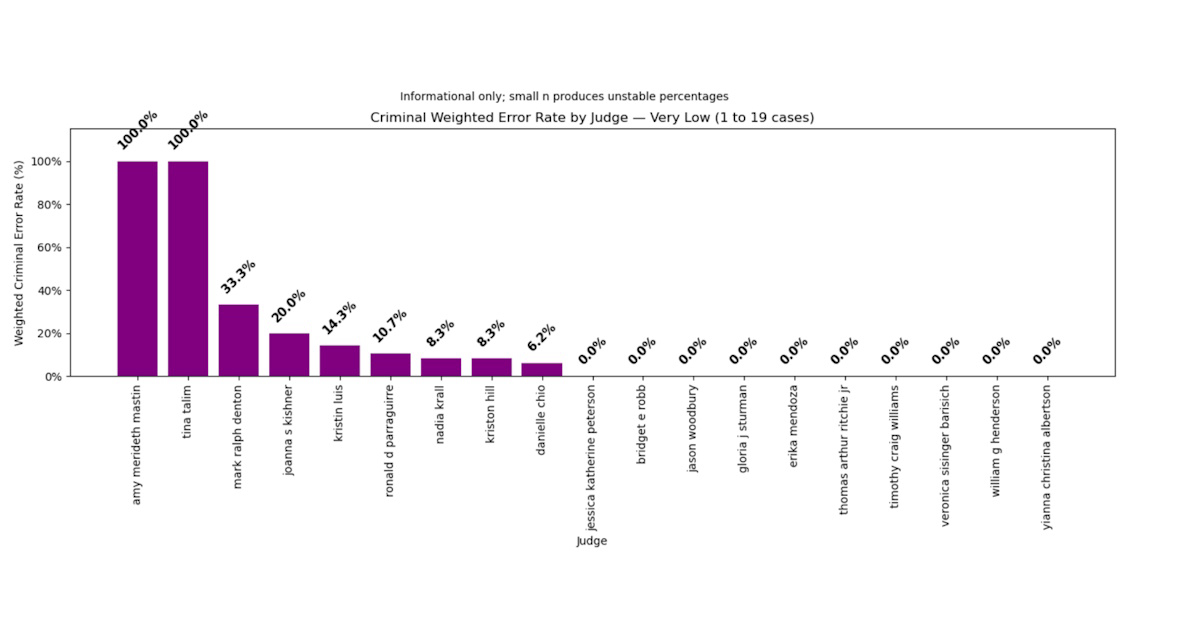
Grouping Judges by Sample Size Reasoning Dividing judges into Very High (200 or more cases), High (100 to 199 cases), Moderate (50 to 99 cases), Low (20 to 49 cases), and Very Low (1 to 19 cases) follows common practices in empirical legal research and social science statistics, where similar thresholds are used to manage sampling error and to separate stable error rates from those influenced by random variation. This classification improves interpretability, promotes fairness, and prevents misleading comparisons between judges with large caseloads and those with only a small number of cases. Why 5 Groups in Criminal Cases vs 3 in Civil Cases Criminal caseloads are both larger and more widely distributed across judges than civil caseloads, naturally forming five sample-size tiers. Civil caseloads cluster into three meaningful groups. Using different category counts ensures that error-rate comparisons within each court type remain statistically stable and interpretable. Civil Court data has a total of 4269 cases across 83 judges, while Criminal Court data has 6216 cases across 48 judges. Civil cases have ~51 cases/judge and Criminal cases have ~129 cases per judge. Criminal judges manage 2.5x more cases per judges than civil judges. Using the same number of categories for both courts would hide the real structure of each caseload distribution. Support from Prior Research Prior research also supports this approach. Studies that estimate judicial error rates typically rely on very large numbers of cases, which highlights the importance of having sufficient case volume in order to produce reliable error measures. For example, Kanaya and Taylor (2020) estimate error probabilities using more than five million court cases from Virginia, demonstrating how large samples reduce statistical noise and yield stable error rate estimates. Final Groupings The full dataset contains 112 judges. 49 judges had 0 criminal appellate cases and were removed from the analysis. The remaining 63 judges were distributed across the five sample-size categories: • Very High: 200 or more cases, 9 judges. • High: 100–199 cases, 13 judges. • Moderate: 50–99 cases, 8 judges. • Low: 20–49 cases, 15 judges. • Very Low: 1–19 cases, 19 judges. These groups form the basis for interpreting the unweighted and weighted error rate charts that follow.
Evaluating Weighted vs. Unweighted Errors
The unweighted charts treat every appellate correction as a full error, regardless of whether the entire judgment was
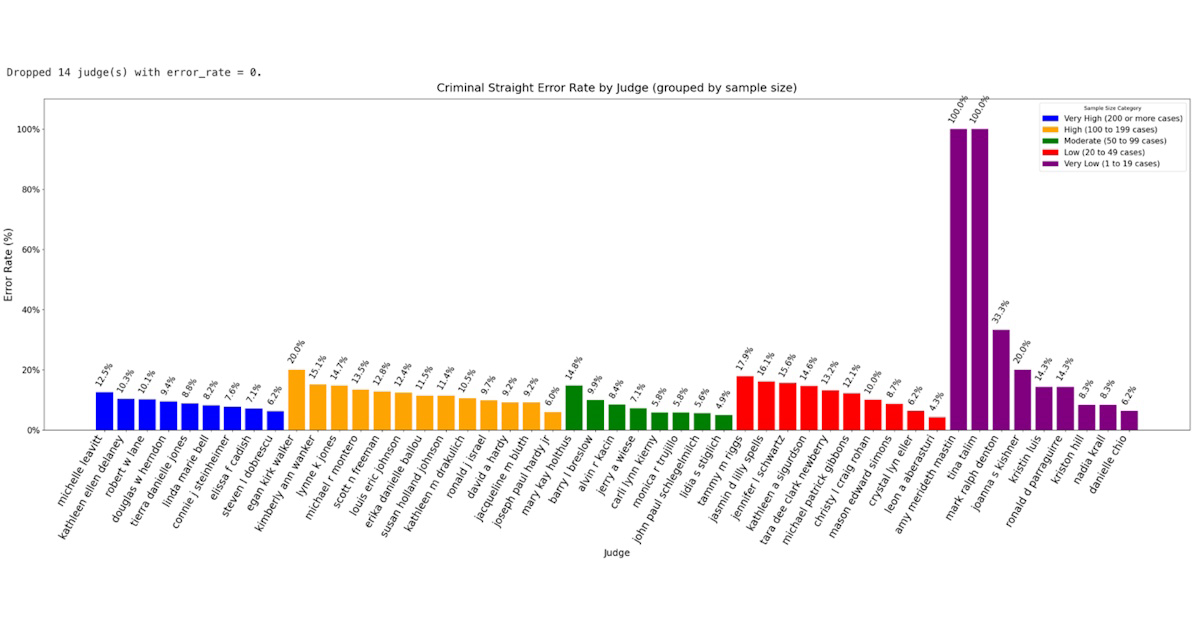
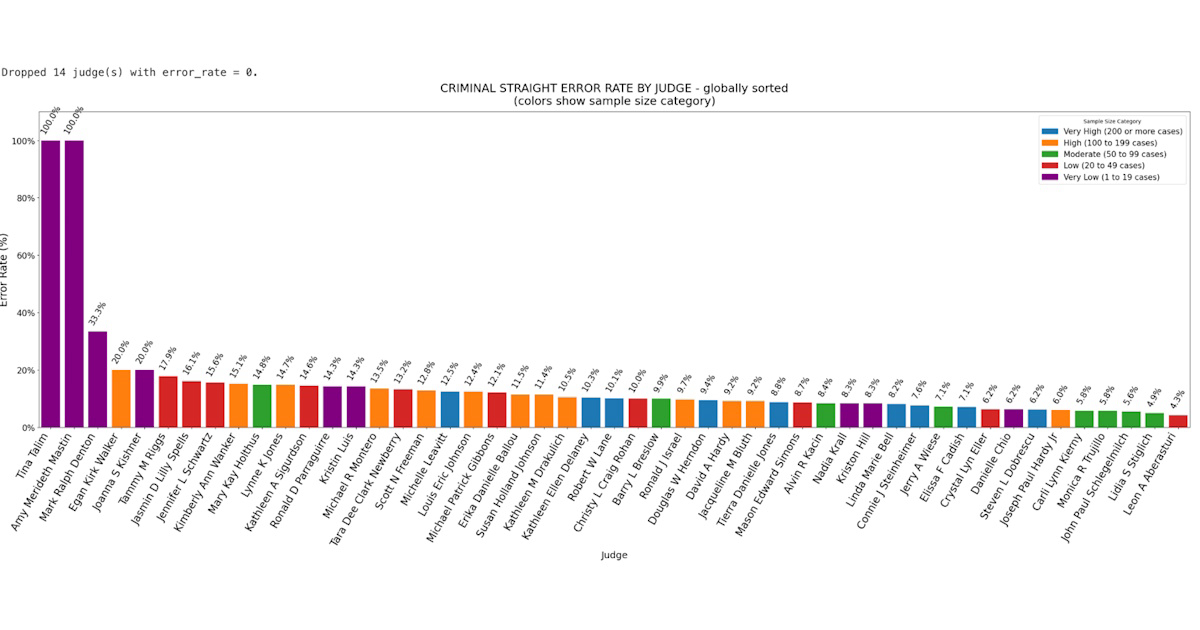
The Unweighted Error Global chart displays the straight (unweighted) criminal error rate for every judge in the dataset who had at least one appellate correction, organized by sample-size category. Judges with larger criminal caseloads (shown in blue and orange) exhibit relatively stable error rates clustered between approximately 7% and 13%. These rates are more reliable because they are derived from larger denominators. In contrast, judges with very small sample sizes (purple bars) show extremely volatile error rates, ranging from modest single-digit values to 100%. These shifts reflect statistical instability rather than meaningful performance differences. For example, a judge with only one or two criminal appellate cases can appear to have either perfect accuracy or a 100% error rate based solely on a single reversal. Grouping judges by caseload helps prevent misinterpretation and allows readers to distinguish reliable error rates from those dominated by random variation. The chart illustrates how sample size heavily influences apparent performance and underscores the need for caution when comparing judges across different caseload volumes.
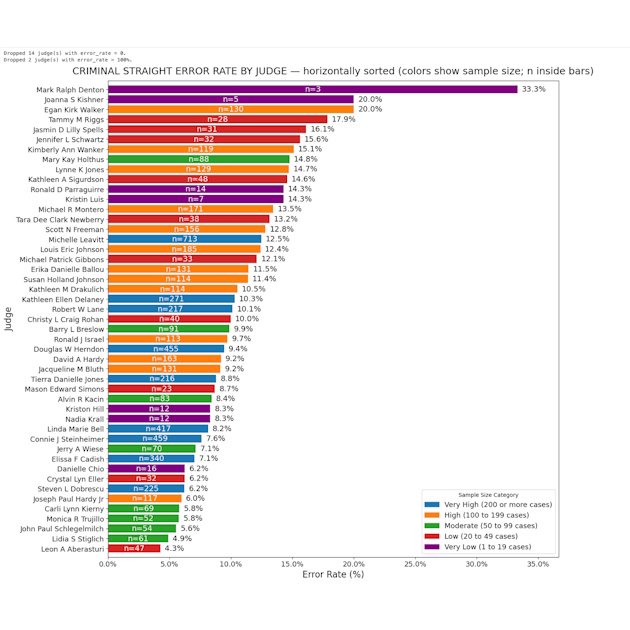
In this study, the error rate is reported in two ways. An unweighted error rate counts any reversal or partial reversal as a full error, which answers the question of: How often appellate courts identify any error in a criminal case? A weighted error rate counts partial reversals as half errors and full reversals as whole errors, which better reflects the magnitude of the underlying mistake. Weighting is appropriate here because the goal is to estimate the overall volume of judicial error across the criminal docket and to compare judges in a way that reflects that a partial reversal indicates a narrower scope of error than a complete reversal. For questions focused solely on how many cases involved any appellate correction, however, the unweighted error rate is more appropriate. A weighted error answers the question of How much judicial error occurred across the criminal docket, adjusting for the fact that partial reversals correct only a portion of the original judgment, while full reversals overturn it entirely? Overall Summary of Criminal Error Rates This analysis provides a data-driven assessment of how often Nevada appellate courts identify mistakes in criminal cases and how substantial those mistakes are. Two measures are used to capture different dimensions of judicial accuracy. Because many appellate outcomes do not overturn the entire judgment, a second measure, the weighted error rate, assigns half credit to partial reversals and full credit to complete reversals. This approach reflects the magnitude of the underlying mistake. When measured this way, the statewide criminal error rate decreases to 6.56%, indicating that while appellate courts frequently make corrections, many involve narrower adjustments rather than full reversals. The charts in this report also show that sample size matters greatly. Judges with large criminal caseloads tend to have stable and consistent error rates. Judges with very small numbers of criminal appeals show extreme percentages, including some appearing at 100%, not because they are more error-prone, but because even one corrected case can produce an exaggerated rate when the denominator is small. Why This Matters for Voters With judicial elections approaching, these findings offer a clearer, more responsible view of performance across the criminal docket. Weighting does not diminish the seriousness of judicial error; it simply measures its scale. Unweighted rates show how often errors occur; weighted rates show how extensive those errors were. Interpreting both, alongside caseload volume, helps voters distinguish meaningful patterns from statistical noise. Together, these measures provide a balanced, transparent, and fair foundation for evaluating judicial performance. References Kanaya, S., & Taylor, L. (2020). Type I and type II error probabilities in the courtroom. TSE-FR
Interpretation Of Judicial Error Rate By Sample Size In Civil Cases
Joanna Ronchi, Data Analyst;
Nov 19, 2025, 8:00 AM
Civil and criminal appeal outcomes follow different patterns because the decision to appeal arises from very different incentives, risks, and case cultures. Criminal appeals are filed routinely, often automatically, because the defendant has little to lose and the constitutional and liberty interests at stake create a strong expectation that errors should be reviewed. Civil appeals, by contrast, are usually filed only when the financial stakes justify the cost, and many litigants choose not to appeal even when an error may have occurred. As a result, civil cases represent a more selective group, while criminal cases represent a broader and more routine cross-section of trial outcomes. Because the underlying appeal cultures differ, the error rates diverge, and it is methodologically appropriate to report civil and criminal error rates separately.
While the court appreciates efforts to bring greater transparency to the court system, we cannot corroborate the data nor verify the source of information, so the court is not in a position to comment on the veracity of the statistics cited in your article.
Why Divide into Sample Sizes in Civil Error Analysis The analysis included 92 judges analyzed across 4,269 total civil cases. The average number of cases per judge ~46.4. This is important since in Criminal court there were 6216 total cases across 63 judges and an average of 98.7 cases per judge. Criminal caseloads have a wider spread and therefore are divided into 5 groups. The separation into 3 groups in Civil Court provides a meaningful separation. Although more judges appear in the civil analysis (92 vs. 63), civil caseloads are tightly clustered around ~50 cases per judge. Criminal caseloads not only involve more cases per judge (approximately double) but also fall into several distinct tiers. This wider spread supports five sample-size groups for criminal court and only three for civil. Sample Size Divisions in Civil Cases This analysis divides judges into three categories based on the number of appellate decisions available for review. The grouping ensures that comparisons of judicial performance account for differences in sample size, which directly affect statistical reliability.
Large Sample Size (Judges with > 50 Appellate Outcomes)
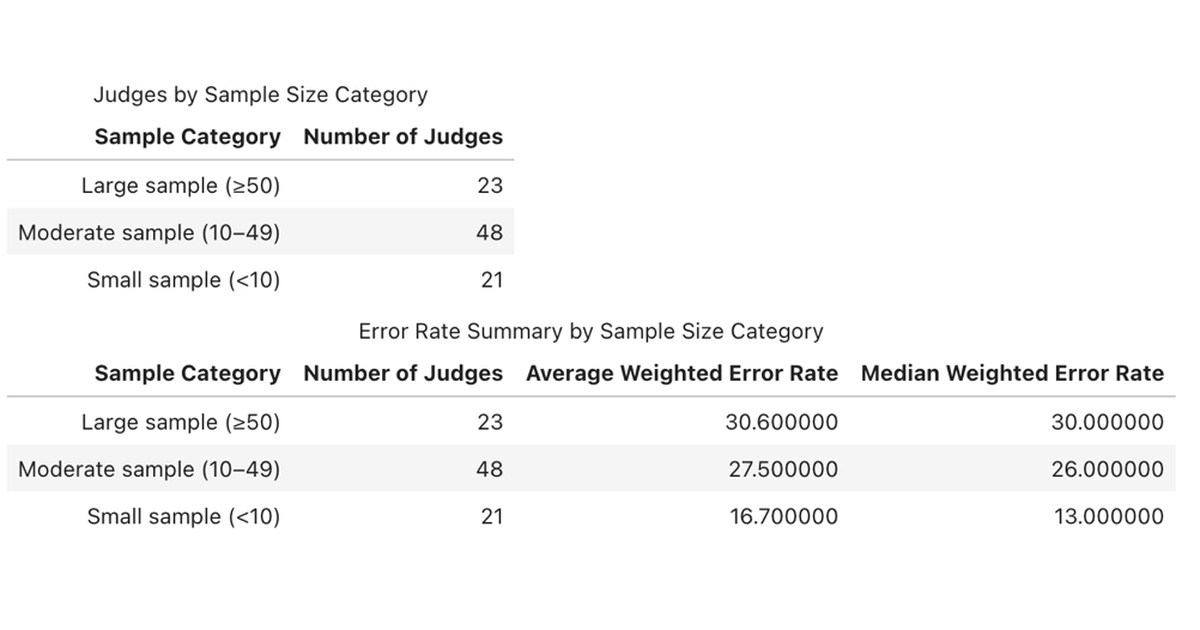
These judges have the most reliable performance indicators. A larger number of reviewed cases provides a stable average, reducing the effect of outliers or case-specific anomalies. The sample includes 23 judges.
Moderate Sample Size (Judges with 10-49 Appellate Outcomes)
This group still offers a reasonably reliable view of performance, though moderate case counts allow for somewhat greater variability in their error rates. The sample includes 48 judges.
Small Sample Size (Judges with fewer than 10 appellate outcomes)
These judges’ rates are not reliable for comparative interpretation. A single reversal or modification can significantly change the percentage, making results statistically unstable. They are shown for transparency, not evaluation. The sample includes 21 judges.
Key Observations
• The average weighted error rate among large-sample judges is 30.6%, meaning roughly 3 in 10 trial-level decisions were
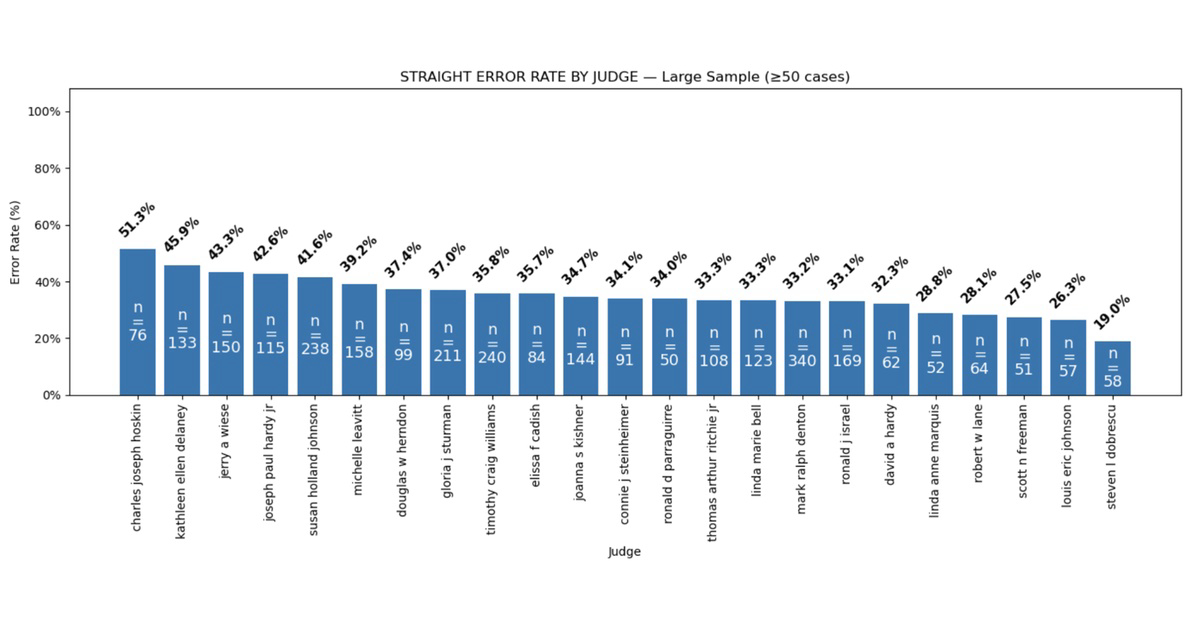
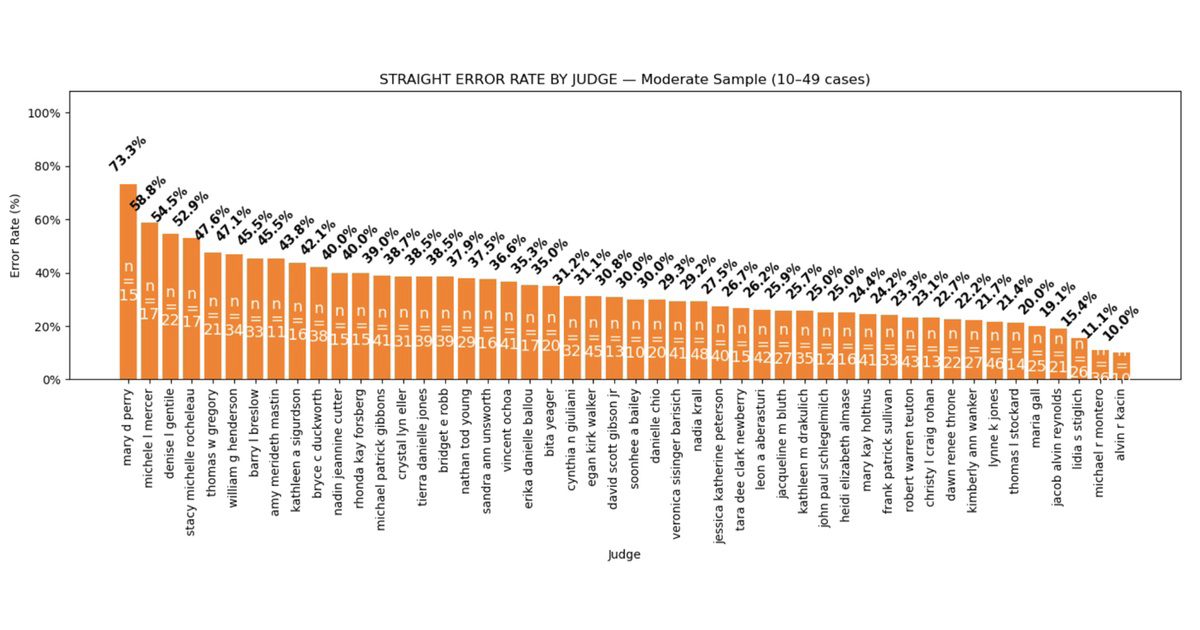
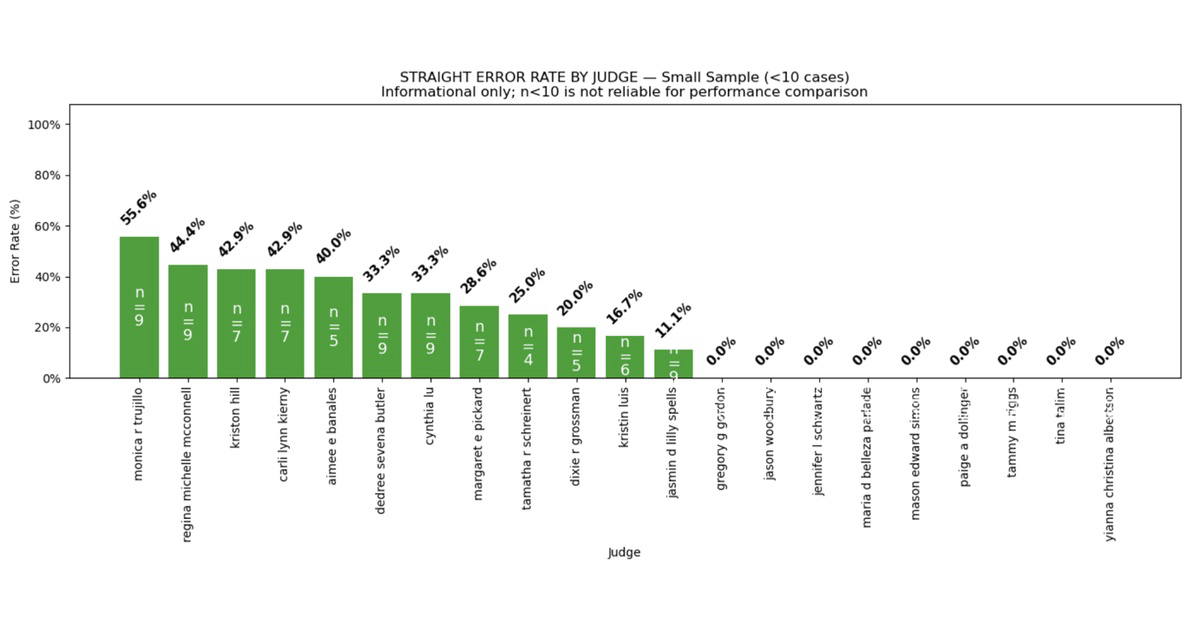
Judges with a larger number of appellate cases provide the most reliable insight into judicial performance, since their error rates are based on more consistent data. Judges with 10–49 appellate cases still offer meaningful information, but small variations should be viewed with caution. Judges with fewer than 10 appellate decisions are included for transparency only (their percentages are statistically unstable and not intended for comparison). Overall, appellate reversal rates across the bench remain within expected norms, reflecting a generally consistent standard of trial-level decision-making.
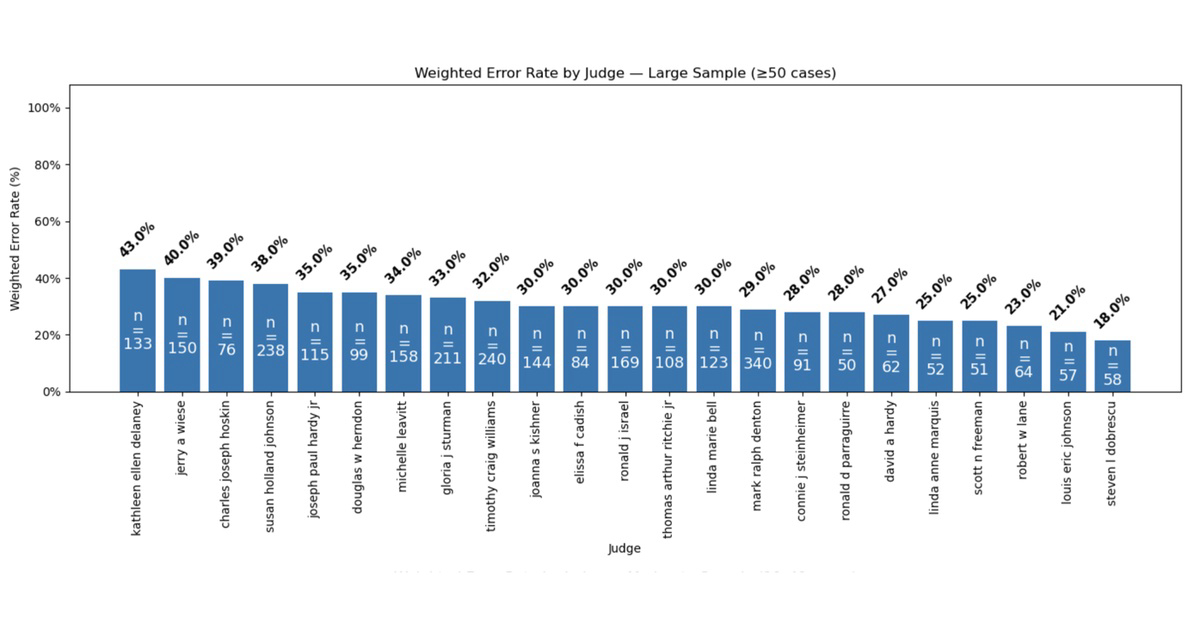
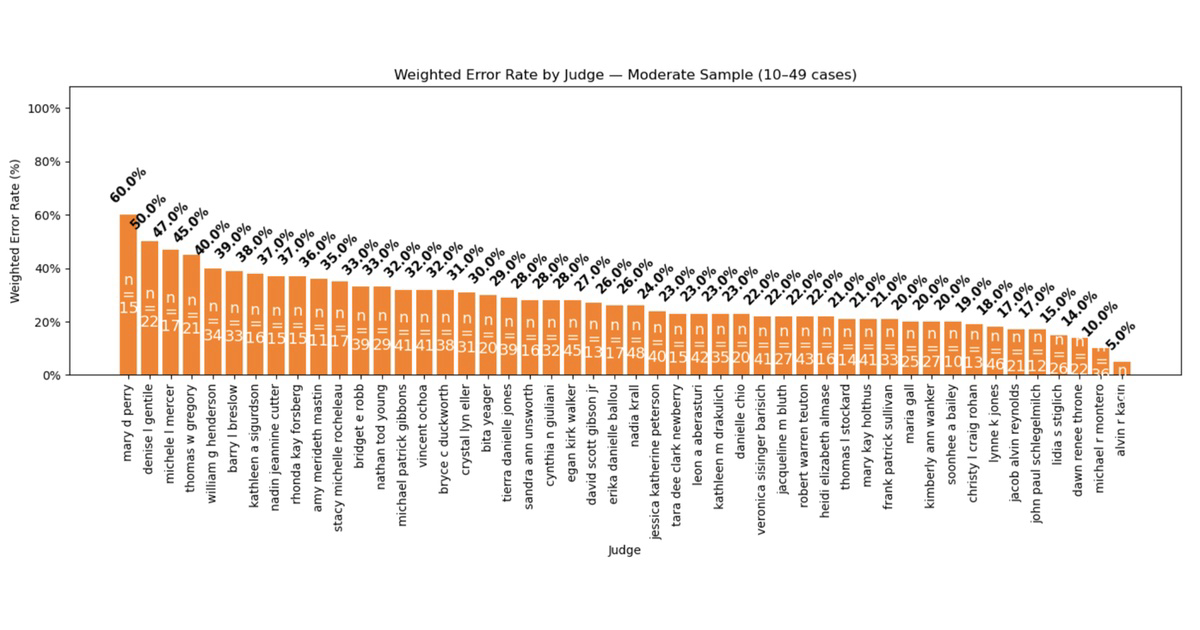
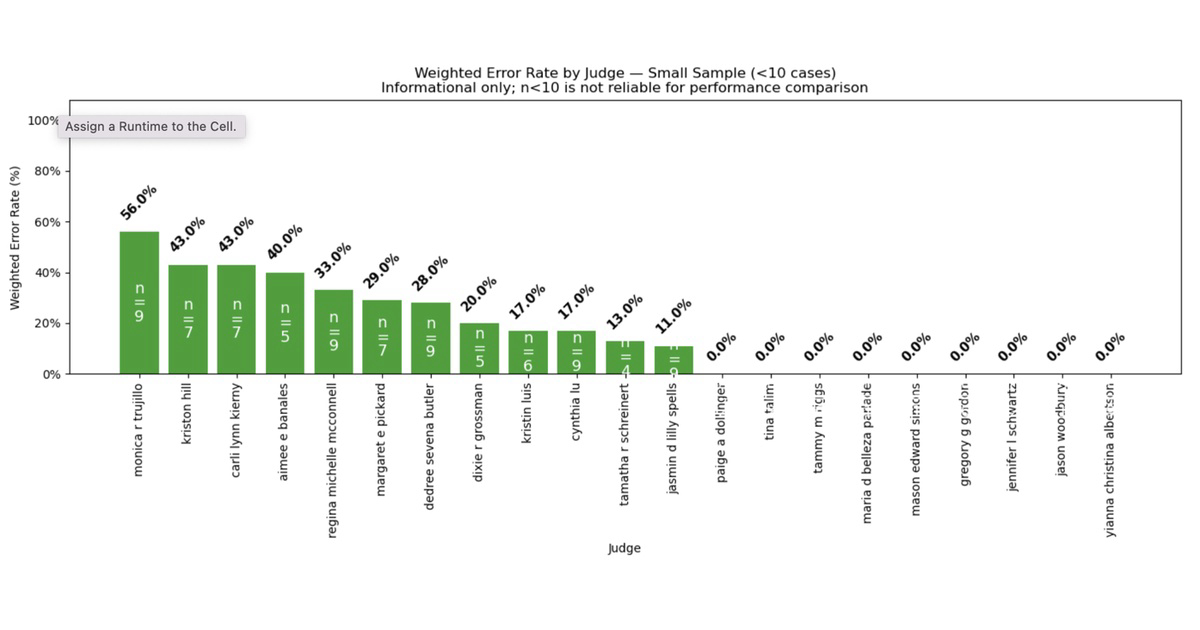
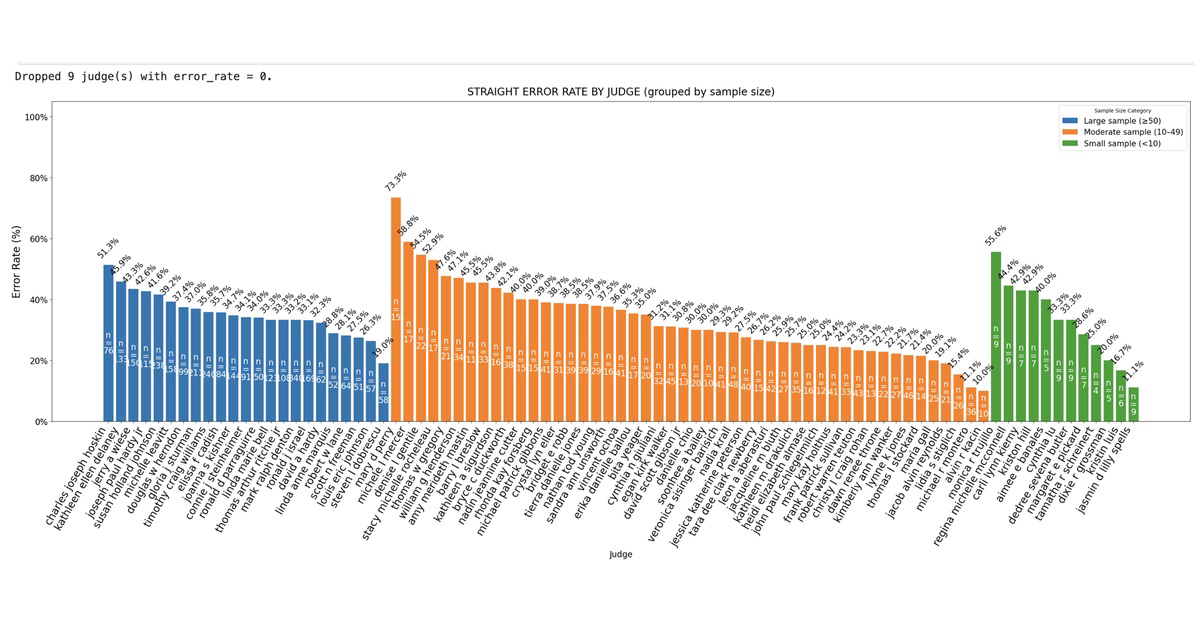
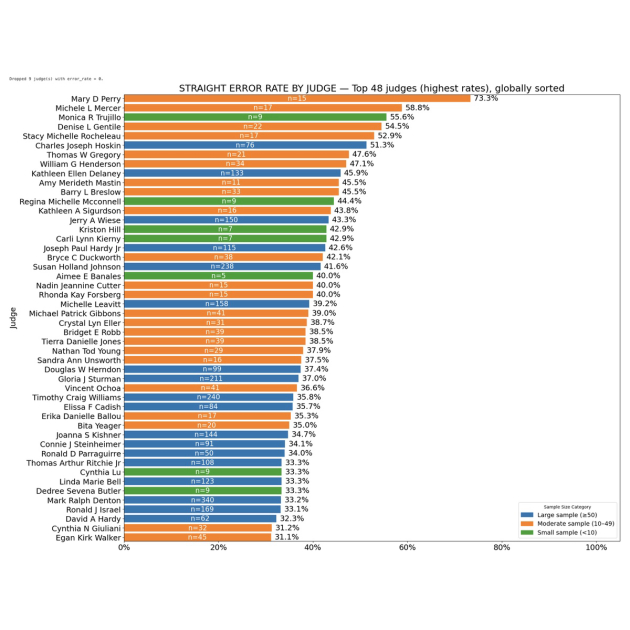
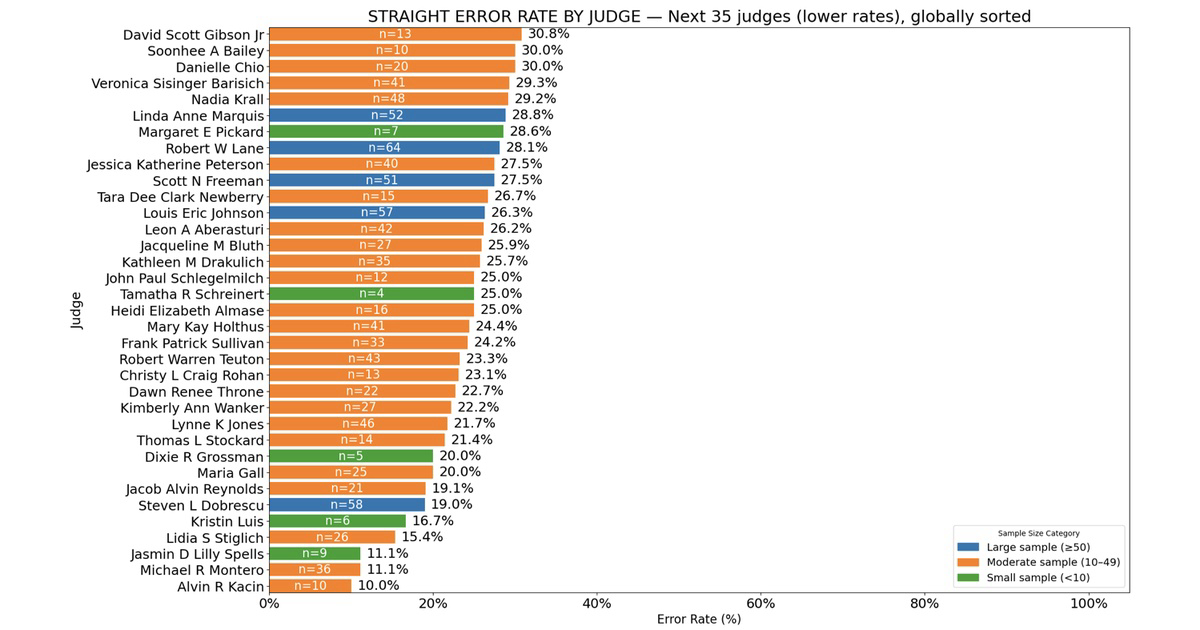
Each bar represents a judge’s percentage of erroneous decisions (reversed or modified on appeal)
out of all reviewed cases.
Color coding
🟦 Large sample (≥50 cases): More statistically reliable averages.
🟧 Moderate sample (10–49 cases): Moderately reliable but may vary with additional cases.
🟩 Small sample (<10 cases): Informational only (not statistically reliable).
Interpretation
The top chart displays the 48 judges with the highest error rates, showing where appellate reversals were most common. The bottom chart shows the remaining judges with lower rates, representing more consistent



©2026 Our Nevada Judges, Inc.
Terms & ConditionsVersion: 5.2.8Privacy Policy
An NRS Chapter 82 non-profit corporation. Recognized by the IRS as a Section 501(c)(3) organization.